From Meter to API: How Time Series Data Unlocks ESG, CSRD and Portfolio Insights

ESG audits fail on data quality, not strategy.
Companies face ongoing challenges with data quality, audit readiness, and adapting to evolving regulatory requirements (EY, 2026).
Auditors reject reports when consumption numbers lack verifiable source data. Monthly invoices and quarterly reads don't meet CSRD traceability requirements. You need time-series utility data, continuous, timestamped consumption records across your entire portfolio.
Without it, reported emissions can't be proven. With it, every data point becomes audit-ready. Artificial intelligence is increasingly used to automate the collection, analysis, and reporting of ESG time series data, improving data quality and enabling advanced analytics.
This article explains why minute-level utility data matters for ESG compliance, CSRD audits, and portfolio benchmarking. Add the energy performance of buildings directive (BACS) to the mix, and real estate portfolios need continuous monitoring infrastructure, not sporadic meter reads.
We’ll show why monthly invoices break down, how time-series data analysis transforms raw sensor data into high quality ESG data, and why an integration layer requires time-series infrastructure to function.
Before evaluating BMS vs EMS systems, understand what data these platforms actually need to deliver value.
What is Time-Series Data? Understanding the Foundation
Sequential Data Points Collected at Regular Intervals
What is meant by time series data? It are sequential data points collected at regular intervals, arranged in chronological order. Each measurement carries a timestamp. This creates a particular structure where the natural ordering of observations matters.
Many time series analysis methods assume a certain structure in the underlying data, often modeling it as a stationary stochastic process.
Real estate utility data follows these principles. Electricity consumption recorded every 15 minutes (or live real-time data) across 200 buildings. Gas usage captured hourly at each site. Water flow measured continuously with data points collected automatically.
Consider the scale: 15-minute intervals generate 96 data points per meter per day. Across a 200-building portfolio with 800 meters, that’s 76,800 daily observations. Over one month, 2.3 million data points collected. Monthly invoices give you 800 numbers. Time-series data gives you 2.3 million traceable points proving exactly what happened.
The Four Components Every Time Series Contains
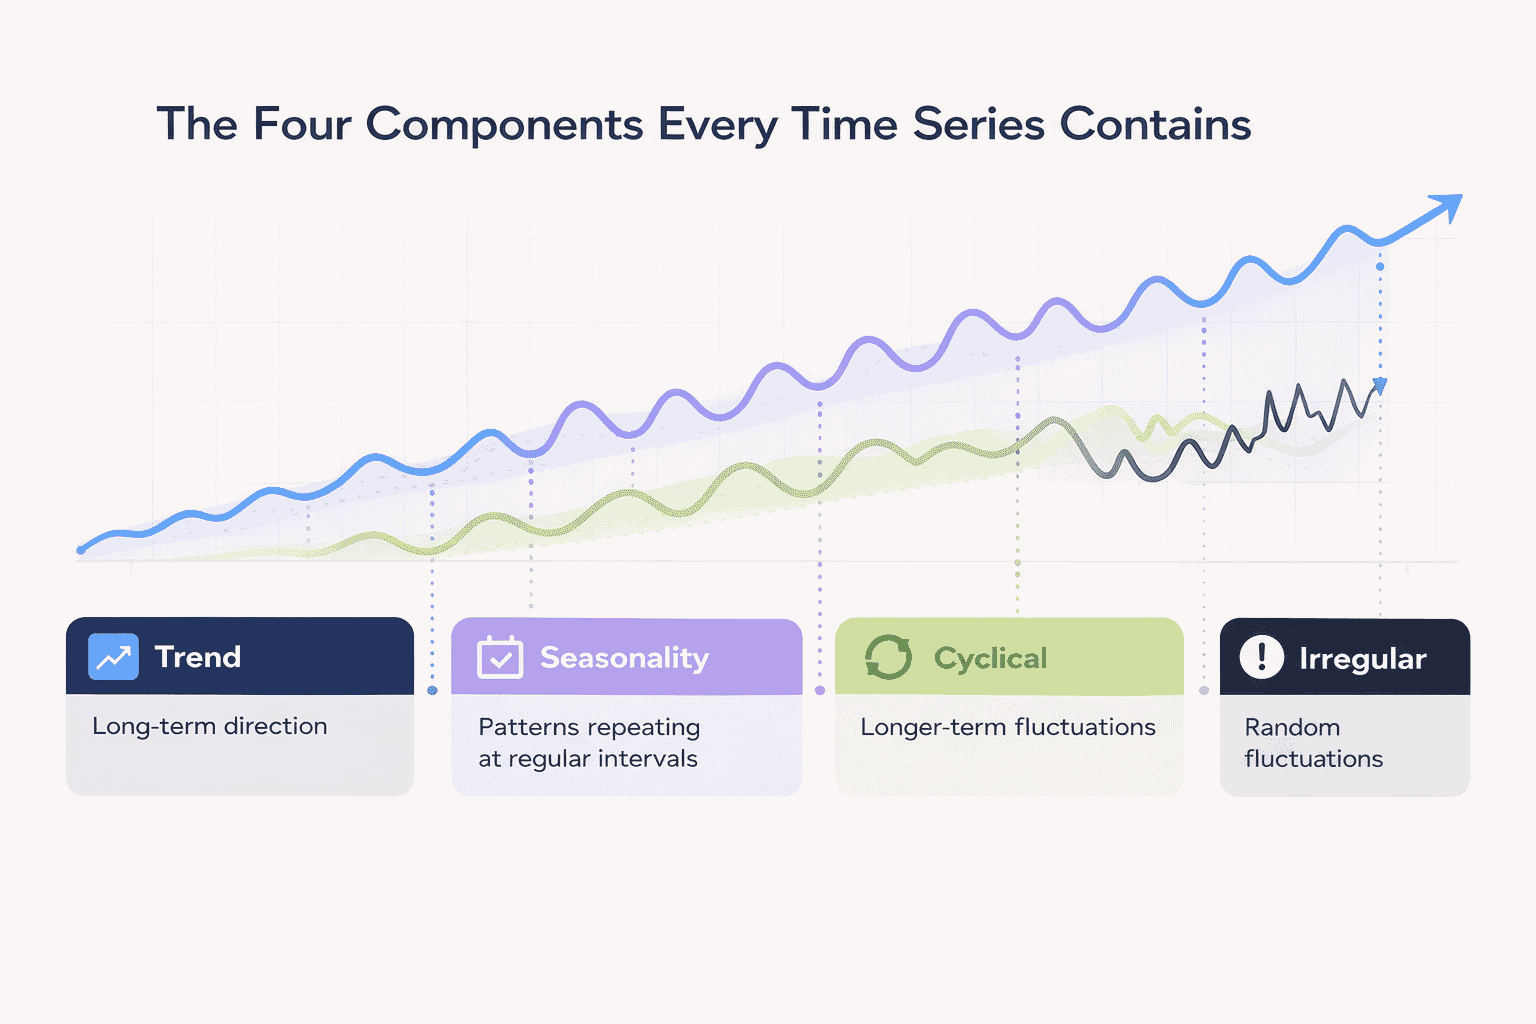
1. Trend
Trends shows long-term direction. Your portfolio might show declining trend from efficiency improvements. An example of an upward trend is a long-term increase in energy consumption or sales over several years. Analyzing time series data over multiple years reveals whether sustainability initiatives actually reduce consumption.
2. Seasonality
Seasonality captures patterns repeating at regular intervals. Seasonality refers to regular periodic occurrences within a smaller time interval, such as spikes in product sales during the holiday season. Heating demand spikes every winter. Cooling loads peak each summer. Understanding seasonality prevents mistaking normal winter increases for efficiency failures.
3. Cyclical
Cyclical components reflect longer-term fluctuations. Economic downturns reduce occupancy over multi-year periods. Unlike seasonality’s fixed intervals, cyclical patterns have irregular time intervals.
4. Irregular
Irregular variations are random elements. Equipment failures cause sudden spikes. Machine learning algorithms distinguish normal variation from actionable anomalies requiring immediate response.
These four components let you predict future consumption and distinguish real efficiency improvements from background variation. Time-series analysis identifies underlying patterns (trends, seasonality, anomalies), that make forecasting accurate and actionable.
What Real Estate Portfolios Actually Have: Sporadic Snapshots, Not Time-Series Data
Most portfolios think they have utility data. What they actually have are monthly invoices and incomplete snapshots.
Monthly invoices provide aggregated totals with no granularity. Your utility bill shows 50,000 kWh consumed in January. One number representing 44,640 minutes of actual consumption. These monthly totals only provide information for a given period, lacking the granularity needed for detailed analysis. Monthly totals erase critical context.
Quarterly meter reads create gaps of 90+ days. Between readings, you have zero observed data. Leaks waste thousands invisibly. Equipment fails undetected. You’re managing portfolio performance with four data points per year per meter, each representing only a given period.
Annual estimates represent the worst case. Utility companies bill on projections, not observed data. For ESG reporting, these aren’t real measurements. Auditors reject estimated data when actual time-series utility data should exist.
You can't detect anomalies from monthly totals. You can't prove consumption patterns with four data points per year. You can't validate ESG claims without continuous records.
Effective anomaly detection, pattern recognition, and consumption analysis require granular time-series data not quarterly summaries.
Why Traditional Systems Can't Deliver Portfolio-Scale Time-Series Data
The Architecture Gap: Built for Different Purposes
At nanoGrid we call this the fhe four-silo problem from utility data management. This exists because traditional systems were never designed to deliver time-series data at portfolio scale.
- Metering companies exist to generate accurate invoices. They read meters monthly or quarterly, validate totals, and produce charges. Most utility providers store interval data for load balancing but don't make it accessible to customers in structured formats. You get a PDF invoice, not an API delivering time-series data.
- Building Management Systems control local equipment. They adjust HVAC, manage lighting schedules, and maintain comfort. BMS platforms collect operational data but typically don't store long-term history. Each building has its own BMS, often from different vendors. There's no portfolio-wide aggregation, no unified time series database spanning all properties.
- ESG platforms analyze data you provide. They calculate carbon footprints and generate compliance reports. But they're analytics tools, not data collectors. Without clean time-series utility data flowing in, they produce unreliable outputs.
- The gap sits between meters and analytics. No traditional system collects utility data continuously across all buildings, validates quality in real time, structures it hierarchically, and provides API access. This is where the utility data integration layer operates.
For a deeper understanding of how these data silos impact your ESG strategy, read our guide on esg data integration.
From Single Building to 200 Properties: Where traditional systems break
Managing utility data for one building differs fundamentally from managing it across 200 properties in eight countries.
Your real estate portfolio contains smart meters from six vendors, legacy pulse meters from the 1990s, analog water meters requiring manual reads, and sub-meters tracking tenant spaces.
Each uses different protocols: M-Bus, Modbus, pulse output, analog signals. Time-series data infrastructure must connect to all of them without requiring wholesale meter replacement.
Buildings in Germany use different metering standards than properties in Belgium or France. Panel data structure enabling cross-country analysis requires normalising these differences into consistent time intervals and standardized formats.
Traditional metering services scale by adding more invoices. BMS platforms scale by installing more local systems. Neither approach creates the unified, continuous time-series utility data that ESG compliance demands.
The CSRD Compliance Problem
Traceability Demands Time-Series Data
CSRD requires traceable Scope 1 and 2 emissions. Every reported kilowatt-hour must link back to a source meter with a timestamp no exceptions. The EU is explicit: your ESG data must show the complete chain from meter reading to carbon calculation. Monthly invoices give you totals, not audit trails (senken, 2025).
Auditors may ask: "How did you measure 847,293 kWh in March?" You show an invoice. They ask: "Which meters? When exactly? What about gaps? How was data quality verified?" The invoice can't answer.
Time-series utility data provides what auditors demand: minute-level records showing exactly when consumption occurred, quality flags identifying automated vs. manual entries, gap documentation for missing periods, and full lineage tracing aggregated numbers back to individual meter pulses.
Beyond CSRD, directives like ISO 50001 and BACS compliance demand the same granular proof across building portfolios.
What auditors may actually verify
Auditors may verify ESG data quality across four criteria:
- Data completeness: Are there missing data in specific periods? Your Q2 report shows 47 of 50 buildings. Three had "meter communication issues." Auditors reject the entire quarter. They demand 100% with documented explanations for gaps.
- Data quality: How were data points collected? Manual readings introduce error. Estimated values aren't observed data. Automated sensor data provides the high quality ESG data auditors require.
- Traceability: Can you prove this number? A time series database provides full history. Every transformation from raw data to final report is logged.
- Consistency: Do numbers align across systems? Without time-based data as single source, inconsistencies hide in aggregation. Time-series data exposes problems immediately.
The International Sustainability Standards Board (ISSB) established frameworks demanding high quality ESG data with verifiable sources.
The Technology Stack: Building Time-Series Infrastructure
Hardware Layer: Connecting Any Meter, Any Protocol
Time-series utility data starts at the hardware level. Your portfolio contains diverse metering infrastructure spanning decades. Smart meters transmit automatically via cellular or ethernet.
Legacy pulse meters need retrofitted communication gateways. Analog water meters require pulse readers converting mechanical signals to digital data.
Hardware-agnostic data collection connects to every meter type without replacing functional equipment, like nanoGrid does. Protocol converters handle M-Bus, Modbus, analog outputs, and proprietary formats: eliminating rip-and-replace costs. Existing meters stay operational. New hardware adds connectivity, not redundancy.
Software: Time Series Database and Validation Engine
The software layer transforms raw sensor data into validated time-series utility data. A software layer validates and structures raw meter data into time-series datasets.
Purpose-built time-series databases handle millions of data points efficiently standard databases can't scale for time-based queries. Results return in seconds, even across multi-year periods.
Continuous validation scores every data point for quality: collection method, historical consistency, cross-meter validation. Anomalies flag instantly. Gaps get documented and timestamped. Estimates are labeled separately from observed data. ESG-ready data flows automatically no manual processing required.
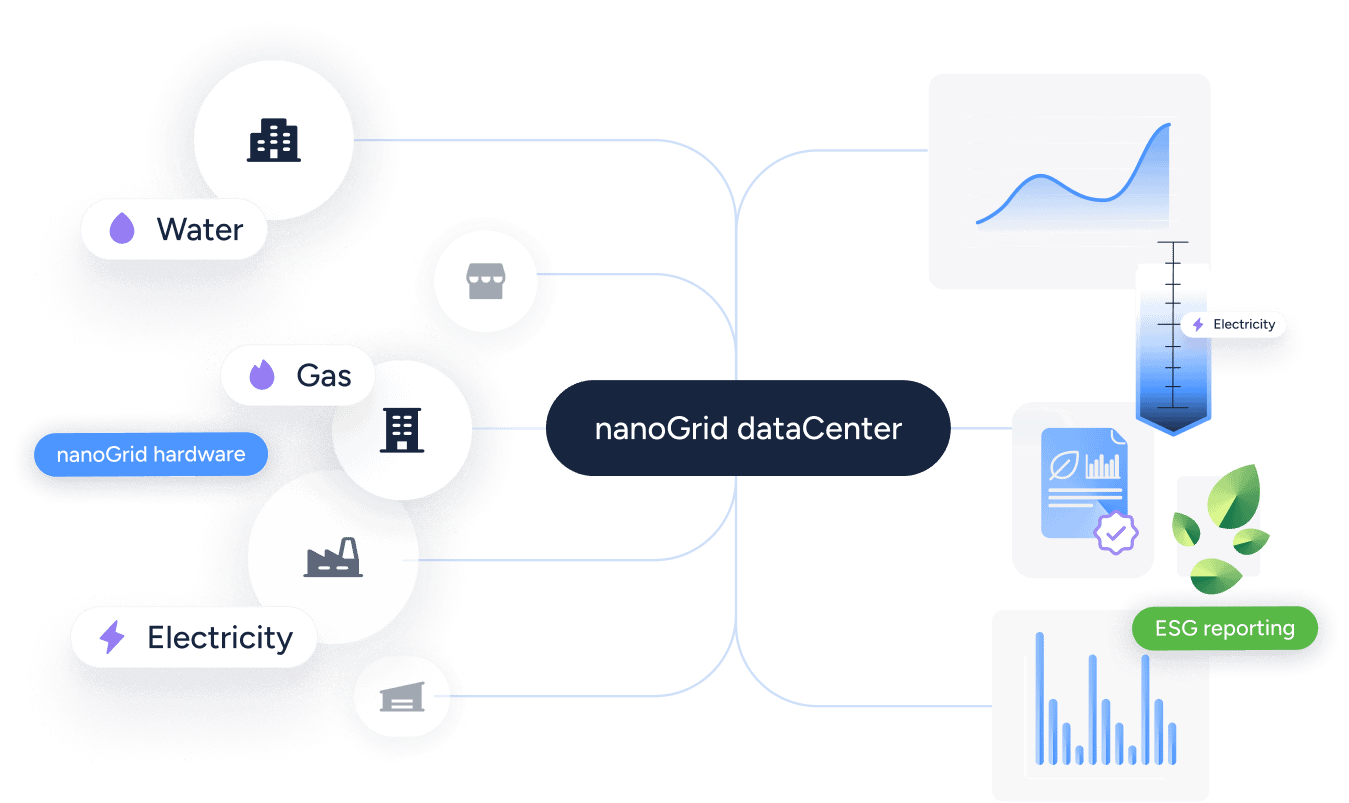
API Layer: Making Data Accessible to Every System
Clean, validated time-series data becomes valuable when accessible. An API layer provides secure, documented access to downstream platforms.
REST APIs enable self-service integration. Your ESG platform queries consumption data for carbon calculations. Your ERP system pulls utility costs for financial reporting. All working from the same single source, eliminating version control chaos.
Pre-built connectors accelerate integration with common platforms. Real estate ESG tools like Measurabl, Deepki, and Scaler (check all nanoGrid's integrations). Building automation systems. Energy management software. An API layer speaks their languages, reducing integration time from months to weeks.
This open architecture prevents vendor lock-in. Your time-series utility data remains accessible regardless of which analytics tools you choose.
The Complete Meter-to-API Pipeline
Five steps transform raw energy meter readings into portfolio intelligence:
Step 1: Universal data collection
Connect to every meter across your portfolio regardless of type, age, or protocol. Capture consumption from every source at the highest frequency each meter supports.
Step 2: Real-time validation
Each measurement gets validated immediately. Does this value fall within expected range? Do sub-meters sum to main meter totals? Anomalies get flagged. Gaps get documented.
Step 3: Structured storage
Raw sensor data gets organized into hierarchical models matching your portfolio structure. Country level for regulatory reporting. Site level for operations. Building level for benchmarking. Meter level for detailed analysis.
Step 4: API provisioning
Clean data becomes accessible to every system that needs it. Your ESG platform, ERP system, and business intelligence tools all pull from the same source.
Step 5: Continuous monitoring
New data points get collected every 15 minutes (or real time monitoring). Quality checks run automatically. Anomalies trigger alerts. Audit trails grow continuously, creating the documented history CSRD demands.
This pipeline transforms utility data management from manual aggregation to automated infrastructure.
Real-Time Analytics: From Data to Action
Anomaly Detection Preventing €180K in Waste
Machine learning models trained on historical data learn normal consumption patterns. When actual consumption deviates from predictions, signal detection algorithms flag the anomaly immediately.
Real time analytics enables catching problems within hours, not months. Monthly invoices show total consumption 30 to 60 days after the fact. Time-series monitoring shows consumption now, with automated alerts for deviations.
Example: A retail portfolio implemented time-series utility data collection across 120 locations. One Tuesday at 3 AM, water consumption at Site 47 spiked to 400% of predicted values. Automated signal detection flagged the anomaly. Facilities received an alert within 15 minutes.
Investigation revealed a burst pipe. Monthly invoices wouldn't have shown this anomaly for another 45 days, buried in aggregated totals. By then, the leak would have wasted an estimated €180K in water and caused structural damage.
Outcome: €180K avoided waste, caught within 24 hours via time-series monitoring. The leak was repaired the same morning. Total damage: €2,400 in parts and labor.
Real time energy data doesn't just enable reporting. It enables action while you can still prevent waste.
Pattern Recognition: What Monthly Totals Hide
Extracting meaningful statistics from millions of data points collected continuously reveals consumption patterns invisible in monthly invoices.
A 2% consumption increase in a monthly invoice looks normal. But the same 2% increase visible in 15-minute interval data tells a different story: after-hours HVAC running every weekend for six months at Building 12.
The monthly total averaged this waste into overall consumption. Time-series data exposed it as specific pattern occurring during specific periods. Facilities investigation revealed a faulty automation schedule.
Fix took 30 minutes.
Savings: €4,200 annually per affected building. Across eight buildings with the same issue: €33,600 annual waste eliminated.
These insights require continuous time-based data. Time series analysis techniques turn raw data into informed decisions supporting both cost reduction and ESG performance improvement.
Conclusion: Time-Series Data as Non-Negotiable Infrastructure
Monthly invoices and quarterly meter reads can't meet CSRD requirements. They lack the traceability, completeness, and granularity that auditors demand. ESG compliance now requires time-series utility data: continuous measurements at regular intervals, creating complete historical records with full audit trails.
The shift is fundamental. Time-series data transforms utility monitoring from reactive billing to proactive management. Real time analytics catches waste within hours. Pattern recognition reveals inefficiencies hidden in monthly totals.
High quality ESG data starts with time-series infrastructure. Before ESG platforms can analyze, before CSRD reports can satisfy auditors, you need continuous data collection creating traceable records.
Companies building time-series data infrastructure now gain operational advantages beyond compliance. They catch equipment failures before costs escalate. They make investment decisions backed by observed data, not estimates. The €180K leak caught in 24 hours. The €33,600 annual waste eliminated through pattern recognition. These aren't theoretical benefits. They're measurable outcomes from treating utility data as infrastructure.
The question isn't whether to implement time-series utility data. CSRD and ISSB requirements made it mandatory. The question is whether you build it now or explain to auditors later why you can't prove your ESG disclosures.
Interested how time series data can be an advantage for your buildings? Book a demo and we’ll walk you through it.
Frequently Asked Questions
What is meant by time series data?
Time series data consists of sequential data points collected at regular intervals in chronological order. For real estate, this means utility consumption recorded continuously, typically every 15 minutes, creating complete historical records with timestamps.
What are the 4 components of the time series?
The four components are: (1) Trend, showing long-term direction; (2) Seasonality, repeating patterns at regular intervals like winter heating; (3) Cyclical, longer-term fluctuations tied to economic factors; (4) Irregular, random variations from equipment failures or one-time events.
What is the difference between time series data and panel data?
Time series data tracks one entity continuously over time. Panel data tracks multiple entities over the same periods. Real estate portfolios use both: time series within each building for detailed analysis, panel data across buildings for comparisons.
What are the four ESG data types?
The four types are: (1) Reported data from published disclosures; (2) Estimated data using proxies; (3) Sampled data from periodic readings; (4) Continuous time-series data from automated sensors. Only continuous time-series data meets CSRD audit requirements.
What are the 5 pillars of data quality?
The five pillars are: (1) Accuracy: is data correct?; (2) Completeness: are there gaps?; (3) Consistency: does data align across systems?; (4) Timeliness: is data available when needed?; (5) Traceability: can you prove it with audit trails?
What is ESG in quality?
ESG data quality refers to the reliability, accuracy, completeness, and verifiability of Environmental, Social, and Governance data. High quality ESG data enables credible reporting, passes audits, and supports investment decisions by financial institutions.
What is an ESG data example?
Time-series electricity consumption showing 47,500 kWh monthly total, built from 2,880 individual 15-minute interval measurements. Each data point is timestamped, quality-scored, and traceable to specific source meters, enabling accurate Scope 2 emissions calculation meeting CSRD compliance.