
Full control over your utility data, from meter to insight.
Get real-time visibility across your buildings, optimize performance, cut waste, and automate ESG reporting from one central platform.

From overlooked to owner-centric
Before nanoGrid
Complex systems, no overview
Mixed meters and siloed systems make it hard to track what’s used where, leaving waste undetected and reports incomplete.
Lack of traceability and accuracy
Manual readings, delays, and third-party gaps make it difficult to verify consumption, prove savings, or pass audits.
The tenant dilemma
When tenants consume but owners carry the burden, sustainability stalls. No visibility means no accountability.
Tracking retrofits is a guessing game
Without baseline data, it’s hard to measure the impact of upgrades, and harder to prove them in your sustainability reporting, like ESG.
After nanoGrid
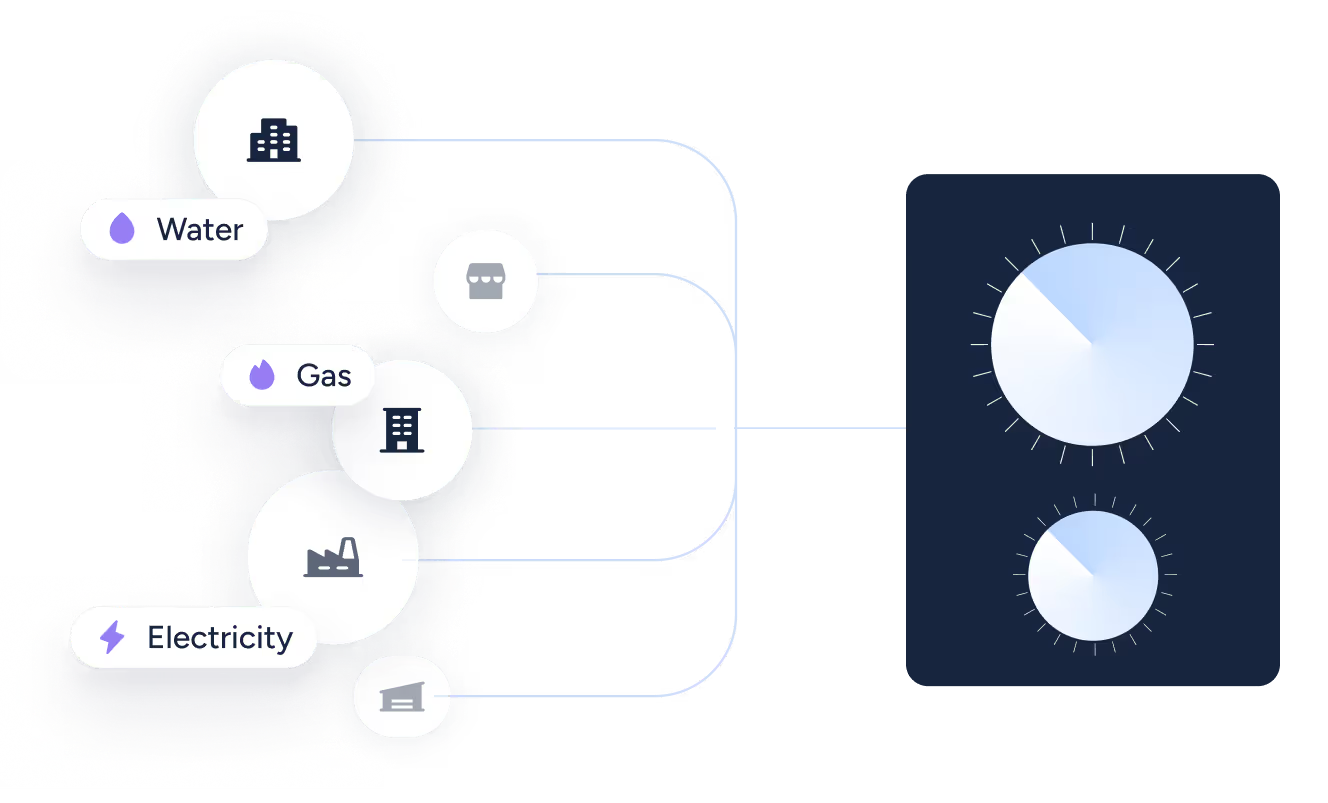
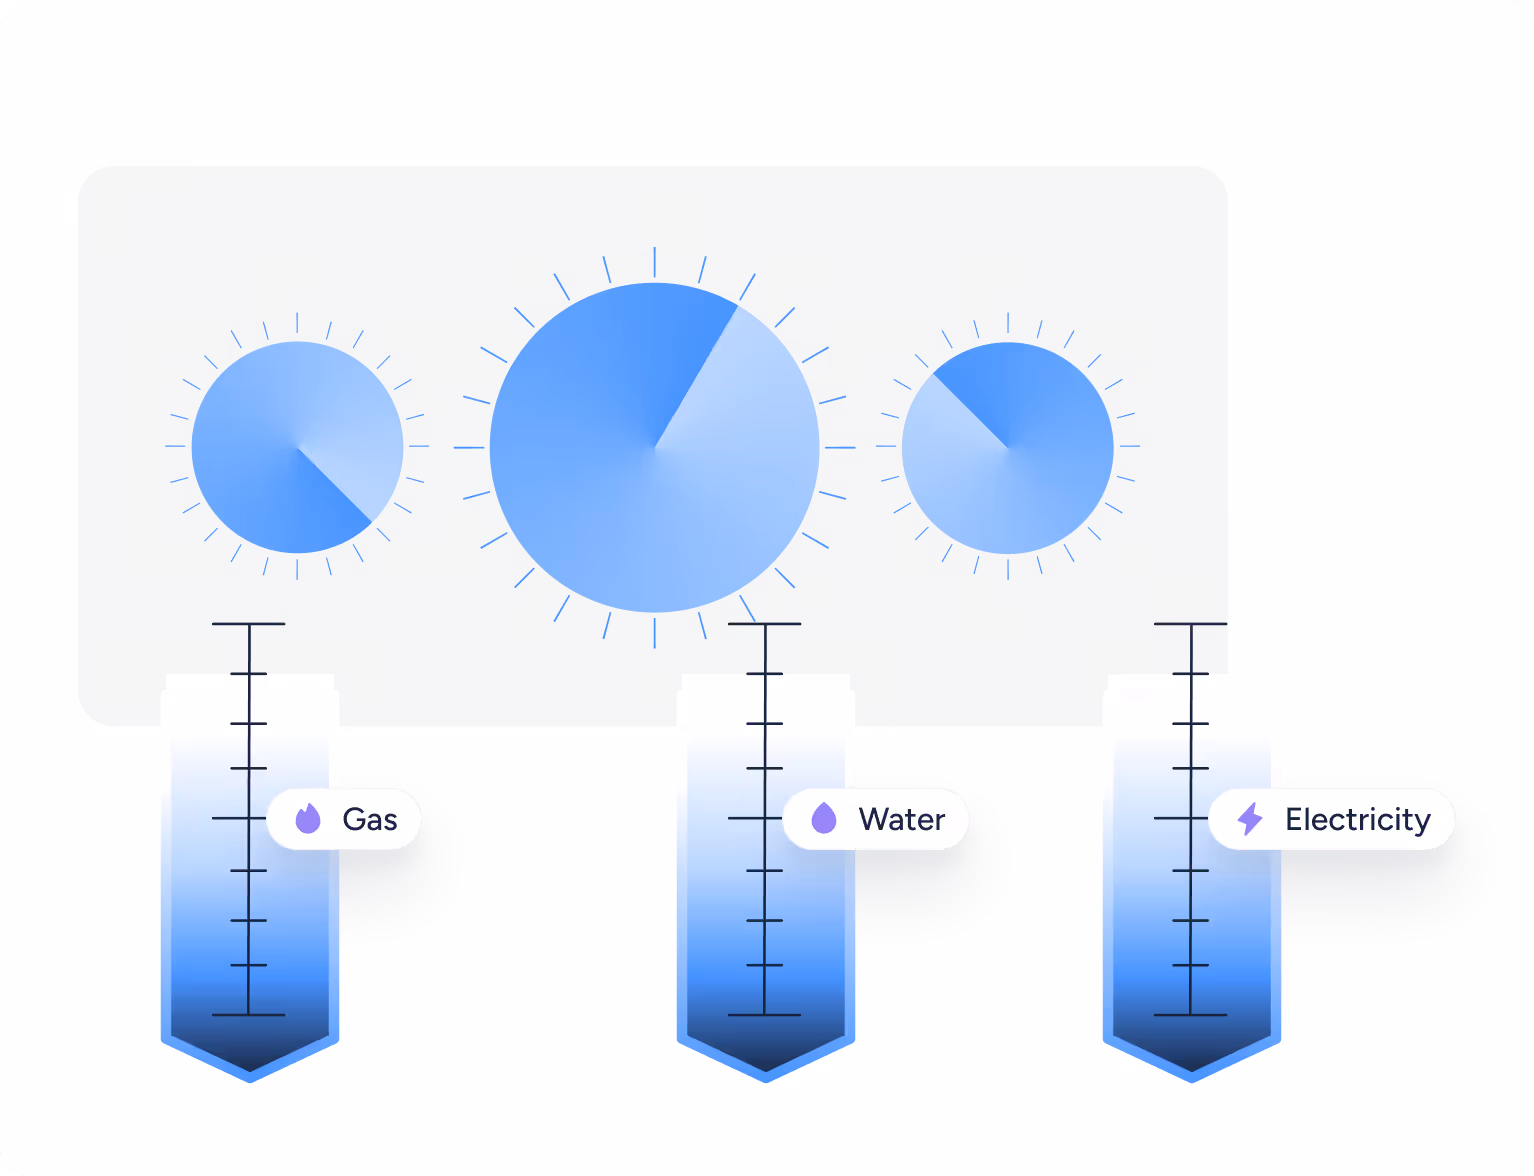
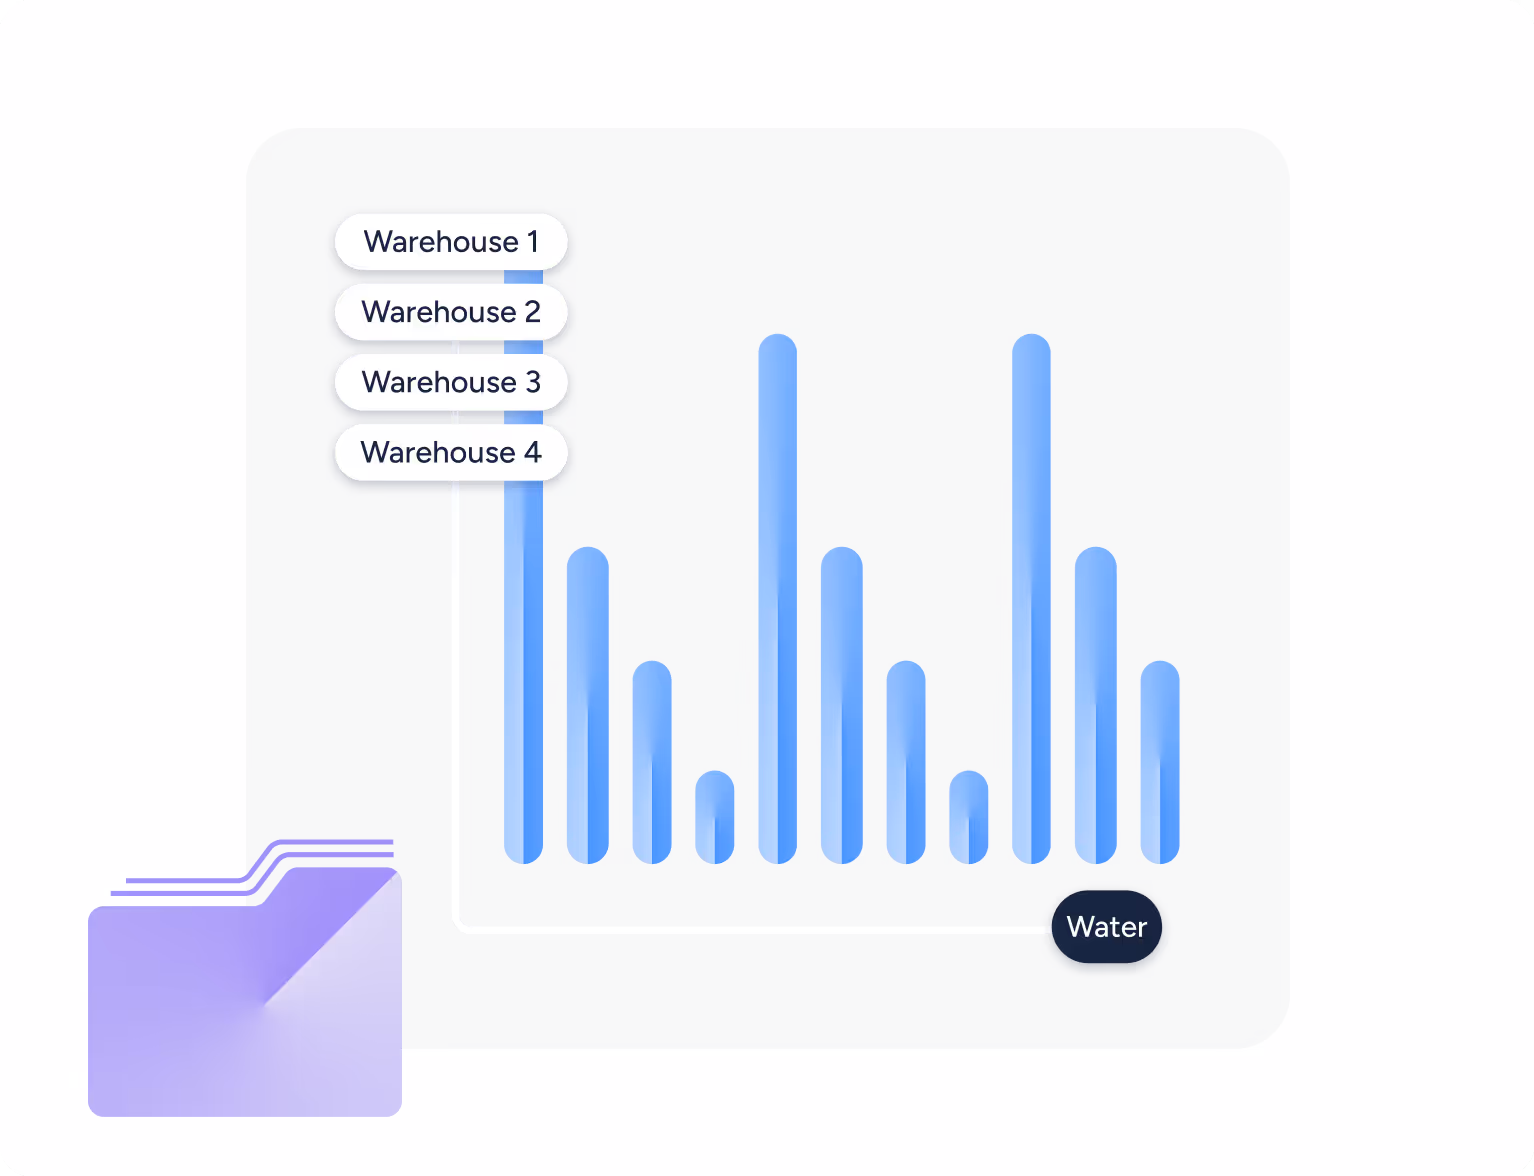
Live utility tracking across your entire portfolio
Monitor electricity, water, gas, and HVAC by the minute, site by site, zone by zone. Spot issues early and bechnmark performance across your buildings.
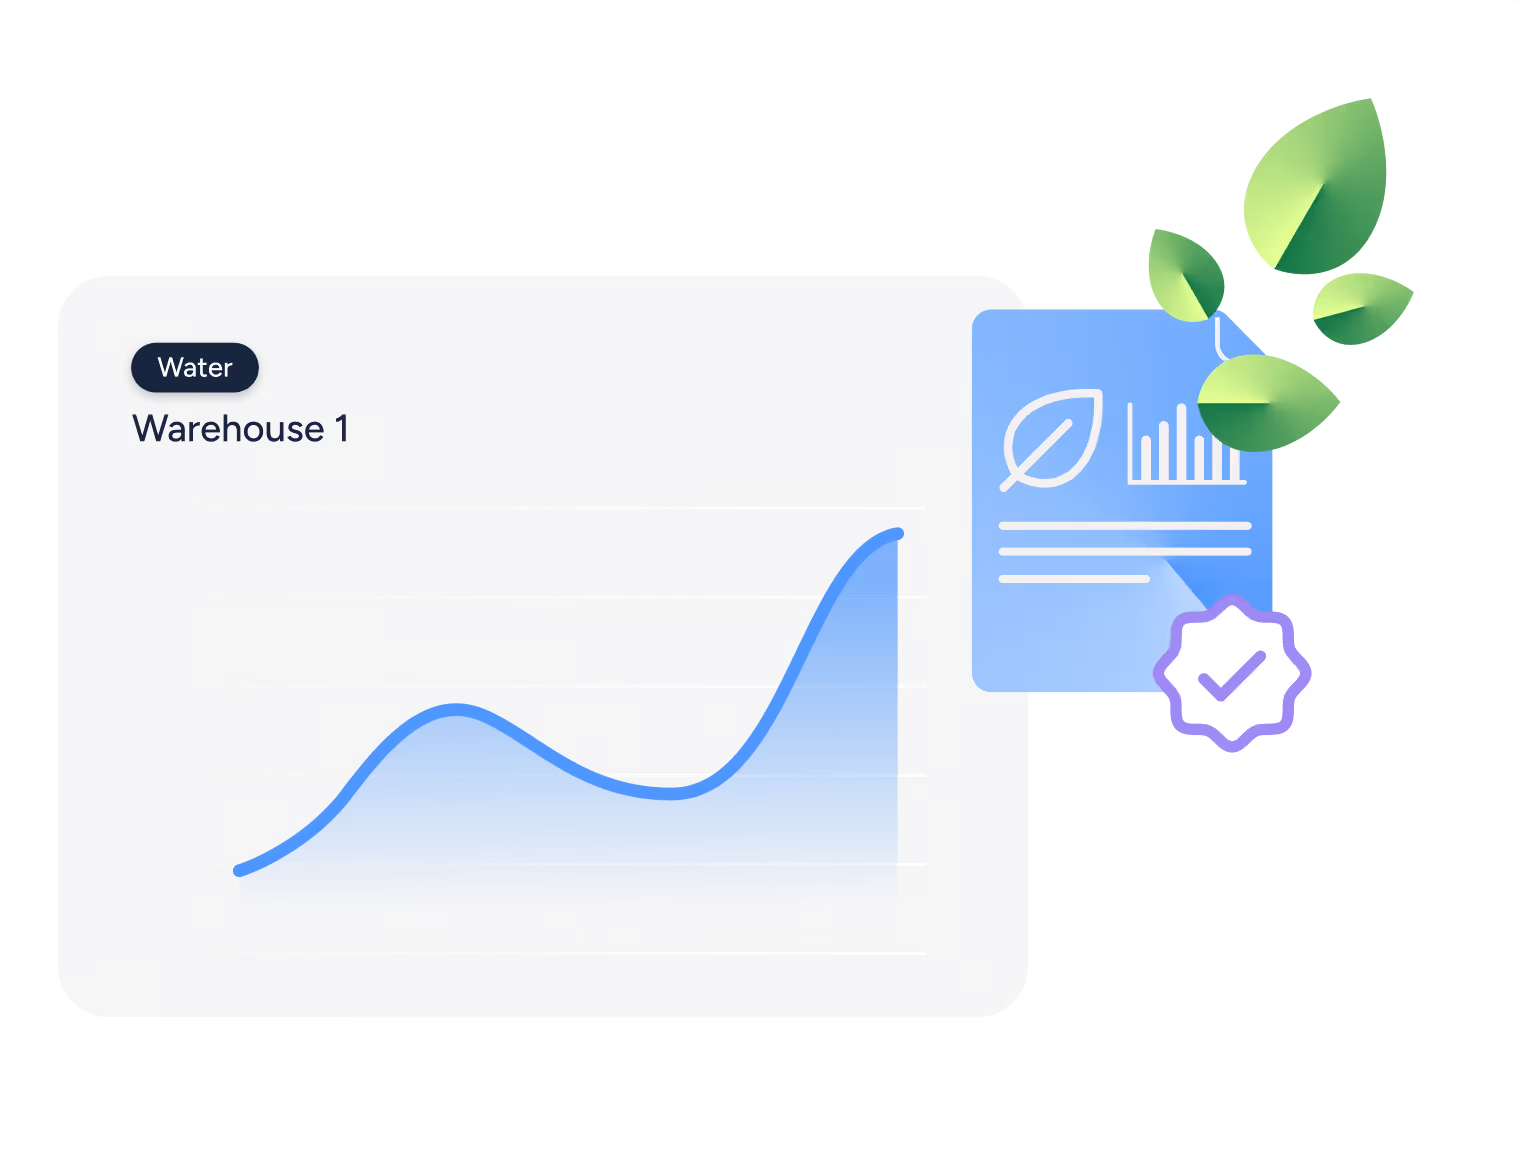
Verified & traceable data, ready for compliance
All data is traceable, timestamped, and exportable to platforms like Deepki, Measurabl, Scaler, or Quantrefy. Easily sumbit to GRESB, BREEAM, CRREM, and EPRA.
Solving the tenant-owner dilemma
Share data with tenants, set clear baselines, and align on sustainability targets, with less friction and more transparency.
Automated reporting and clear insights
Stop chasing spreadsheets. Use dashboards to spot inefficiencies and export certified data for CSRD, GRESB, BREEAM, and more.
How owners take control
From rising costs to ESG pressure, utility blind spots slow you down. nanoGrid brings everything into focus, helping owners control usage, cut waste, and boost asset value.
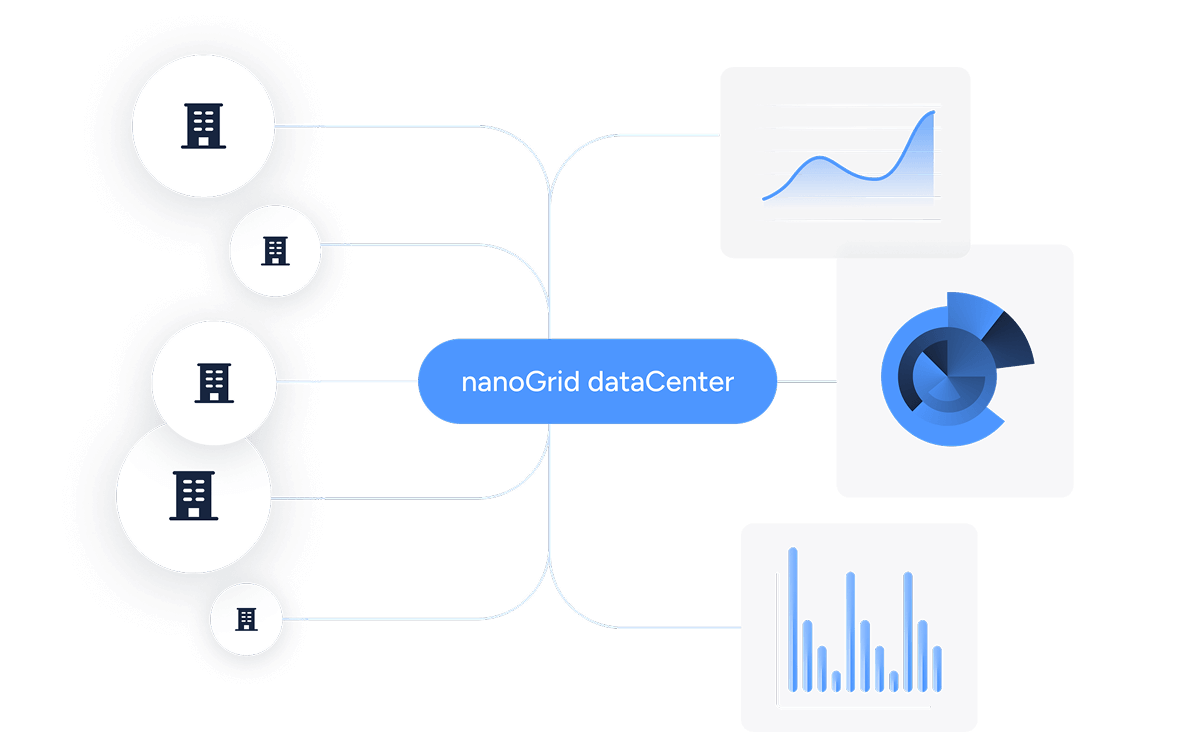
Capture utility data you can actually use
Capture minute-by-minute data from every utility meter, no matter the age, brand, or location. nanoGrid turns fragmented readings into traceable, audit-proof insights. Ready to act on, report with, and scale across your entire portfolio.
Make existing meters smart, without replacement
No need to rip and replace. nanoGrid connects to your existing meters and retrofits them with real-time tracking and traceable outputs. You unlock smarter insights, prove savings instantly, and bring older assets in line with today’s standards.
Automate your ESG reporting, once and for all
Push verified utility data directly into your internal data lake, or favourite ESG tools. No spreadsheets needed. nanoGrid’s data is audit-ready, framework-aligned, and compatible with CSRD, GRESB, BREEAM, GRESB and more.
Analyse and optimise your portfolio with confidence
See how each asset performs, benchmark across countries, and compare layouts, regions, or sites. All in one platform. nanoGrid gives owners the clarity to prioritize upgrades, cut waste, and improve long-term asset value.
Made for your industry
Logistics sites are complex, with high energy use, outdated meters, and scattered data across warehouses, distribution centers, and transport hubs. nanoGrid captures live utility data from every zone, system, and sit, regardless of equipment age or infrastructure setup. You get real-time visibility into consumption patterns, portfolio-wide benchmarking to identify underperformers, and automated ESG reporting that eliminates manual data collection. Track energy, water, and gas across your entire network from one central platform.

Rising energy costs and tight margins make efficiency non-negotiable. nanoGrid gives retailers a clear view of utility usage across every store, warehouse, distribution center, or franchise location. Track consumption in real time, identify waste before it impacts your bottom line, and set automated alerts when usage patterns deviate. Benchmark performance across locations, streamline sustainability reporting, and make data-driven decisions that protect margins without compromising operations.

Care centers demand constant comfort and run intensive HVAC systems around the clock to maintain patient wellbeing. nanoGrid delivers real-time insights into electricity, water, and indoor air quality across facilities. Helping you reduce operational waste without compromising care standards. Benchmark energy performance across your portfolio, identify inefficient sites, and automate compliance reporting for regulatory requirements. Your teams get the data they need to optimize operations while keeping residents comfortable and safe.

Hotels consume energy 24/7 across rooms, kitchens, pools, and public spaces but many still rely on delayed or estimated utility data. nanoGrid centralizes energy-related data from every meter and system for live insights and instant alerts. Improve operational efficiency during peak and off-peak periods, control costs across your property portfolio, and meet sustainability standards with automated reporting. Track guest comfort metrics alongside consumption to balance experience with efficiency.

Office buildings and residential portfolios both need accurate utility data for tenant comfort, transparent billing, and compliance. nanoGrid monitors HVAC, lighting, and air quality in real time across commercial tenants and residential units. Property owners and occupants share one reliable view of building performance. Get per-unit visibility across electricity, gas, water, and heat. Data flows directly into your internal systems, billing platforms, or ESG reporting tools. Eliminating manual reconciliation and tenant disputes.

Leisure parks face extreme seasonal demand with fragmented systems across pools, attractions, kitchens, and facilities. Unmanned sites risk undetected waste or equipment failure without constant oversight. nanoGrid delivers one unified dashboard for live monitoring, automated alerts, and remote control options. Manage demand peaks, detect anomalies before they escalate, and prevent issues even without boots on the ground. Track usage patterns during off-seasons, optimize energy consumption across zones, and keep everything traceable with full audit trails.

Your industry not listed?
nanoGrid adapts to complex environments across industries, even those not listed here. If you don’t see your industry, we’ll still make it work.
Contact us, and we’ll explore the best setup for your organization
There’s more to read

From Meter to ESG Report: How to Build a Future-Ready Energy Data Management System

Energy Data Management: Why Data Quality Is the Real Problem in ESG Reporting

Automatic Meter Reading vs. Real-Time Meter Data: What Multi-Site Businesses Actually Need