The ESG Data Integration Gap no one in Real Estate talks about

Every system in your building stack claims to handle energy data. Your metering company tracks consumption. Your BMS monitors equipment. Your ESG platform generates compliance reports. So why does reporting accurate, audit-ready ESG data still feel impossible?
Because handling data and owning data quality are fundamentally different things.
Only 57% of real estate companies have a comprehensive data management strategy, while 76% still rely on Excel spreadsheets for ESG data, despite acknowledging its limitations (GRESB, 2025).
Big real estate portfolios often operate across four systems with four purposes. None were designed to ensure data accuracy, continuity, and structure across your entire portfolio. The result: ESG data integration fails not because organizations lack technology, but because no single system takes responsibility for the data layer connecting them all.
This article maps each system's role, exposes the gaps, and explains why real ESG data integration requires a dedicated utility data hub like nanoGrid. If you haven't read our guides on utility data management and time series data yet, both provide essential context for understanding why this integration layer has become non-negotiable.
Four Systems. One Shared Problem.
The Landscape Every Real Estate Portfolio Operates In
Most real estate portfolios already have all four systems in place:
- Metering companies recording consumption
- Building Management Systems controlling equipment
- ESG tools generating sustainability reports
- And somewhere in between, teams manually map data from all three.
Each system serves a specific function. Each does its job reasonably well. But none ensures data accuracy, continuity, and structure across your full portfolio. And that's precisely where ESG data integration breaks down.
The gap isn't inside any single system. It's between them:
- Data collected by metering companies doesn't flow automatically to your ESG platform
- BMS sensor data doesn't feed your sustainability reports
- ESG tools accept whatever users provide
The result: fragmented datasets, manual processes, and compliance risk hiding in every gap.
Understanding why requires examining what each system actually does.
1. Metering Companies: Built for Billing, Not ESG Data
What they do well
Metering companies perform an essential function. They install meters, record official consumption readings, and generate accurate invoices for electricity, gas, and water. For billing purposes, they're reliable. Regulatory compliance around invoicing and network tariffs depends on their accuracy.
Customers receive verified consumption totals. Utility providers settle network costs. Grid operators balance loads. This is what metering infrastructure was designed to support, and it supports it well.
Where they fall short
The moment you need data beyond billing, metering companies reach their limits.
Most deliver monthly or quarterly data. Some portfolios still receive annual totals with estimated interim invoices. There's no utility time series data. No granularity showing when consumption occurred or why it spiked. No ability to detect anomalies between billing cycles.
Data arrives fragmented by utility provider, region, and contract. A portfolio operating across Belgium, Germany, and the Netherlands works with different metering companies in each country, each with their own formats, portals, and reporting schedules. Consolidating this into a single dataset requires significant manual effort.
Most critically: invoices provide no audit trail for ESG disclosures. An invoice is a closing price. It shows total consumption for a given period but provides zero traceability back to individual meters, timestamps, or quality-validated data points. CSRD auditors don't accept invoice-based submissions. They require traceable, verified consumption records that metering companies simply don't provide.
2. ESG Reporting Tools: Powerful Analytics, Fragile Foundations
What they do well
ESG reporting platforms transformed how organisations communicate sustainability performance. They calculate CSRD compliance metrics, generate GRESB scores, produce investor ESG disclosures, and benchmark portfolio performance against industry standards. Their reporting capabilities and data visualisation features give real estate professionals powerful tools for communicating ESG data to investors, regulators, and consumers.
For sustainability reporting, they deliver genuine analytical value.
Where they fall short
ESG tools are analytics engines. They are not data collectors.
They accept whatever users feed them. CSV uploads from spreadsheets. Manual entries from facilities teams. Estimated values when actual data isn't available. The platform processes these inputs and generates sophisticated reports regardless of underlying data quality.
This creates a critical problem. ESG data quality depends entirely on what flows in. Poor source data produces polished reports built on unreliable foundations. Investors making risk management decisions based on these reports receive inaccurate insights. Regulators reviewing ESG disclosures find unverifiable claims.
The result: greenwashing risk. Not intentional deception, but systematic data quality failure dressed in professional reporting. Organisations invest heavily in ESG software while neglecting the data infrastructure that determines whether outputs mean anything.
Sophisticated reporting built on fragmented, unverified data doesn't demonstrate social responsibility. It creates compliance and reputational risk that no user interface can hide.
3. Building Management Systems: Control Without Data Continuity
What they do well
Building management systems regulate HVAC, manage lighting schedules, control access systems, and maintain comfortable environments for occupants. Modern BMS platforms provide real-time operational sensor data at building level, enabling facilities teams to respond quickly to equipment issues and optimize comfort conditions.
For local building control and comfort, they deliver genuine value.
Where they fall short
Every property in your portfolio likely runs a different BMS. Different vendors, different generations, different data formats. Data remains trapped in local systems with no standardised way to aggregate it portfolio-wide.
A portfolio with 50 buildings might operate 12 different BMS vendors at the same time. Extracting ESG data from that environment requires custom integrations for each system and produces inconsistent outputs.
BMS platforms weren't designed for ESG reporting or external audit. They were designed for building control. The time series data they generate stays siloed per building, never aggregating into the portfolio-wide view that utility data management requires for credible ESG disclosures.
The Missing Layer: What ESG Data Integration Actually Requires
What a utility data hub is (and what it does)
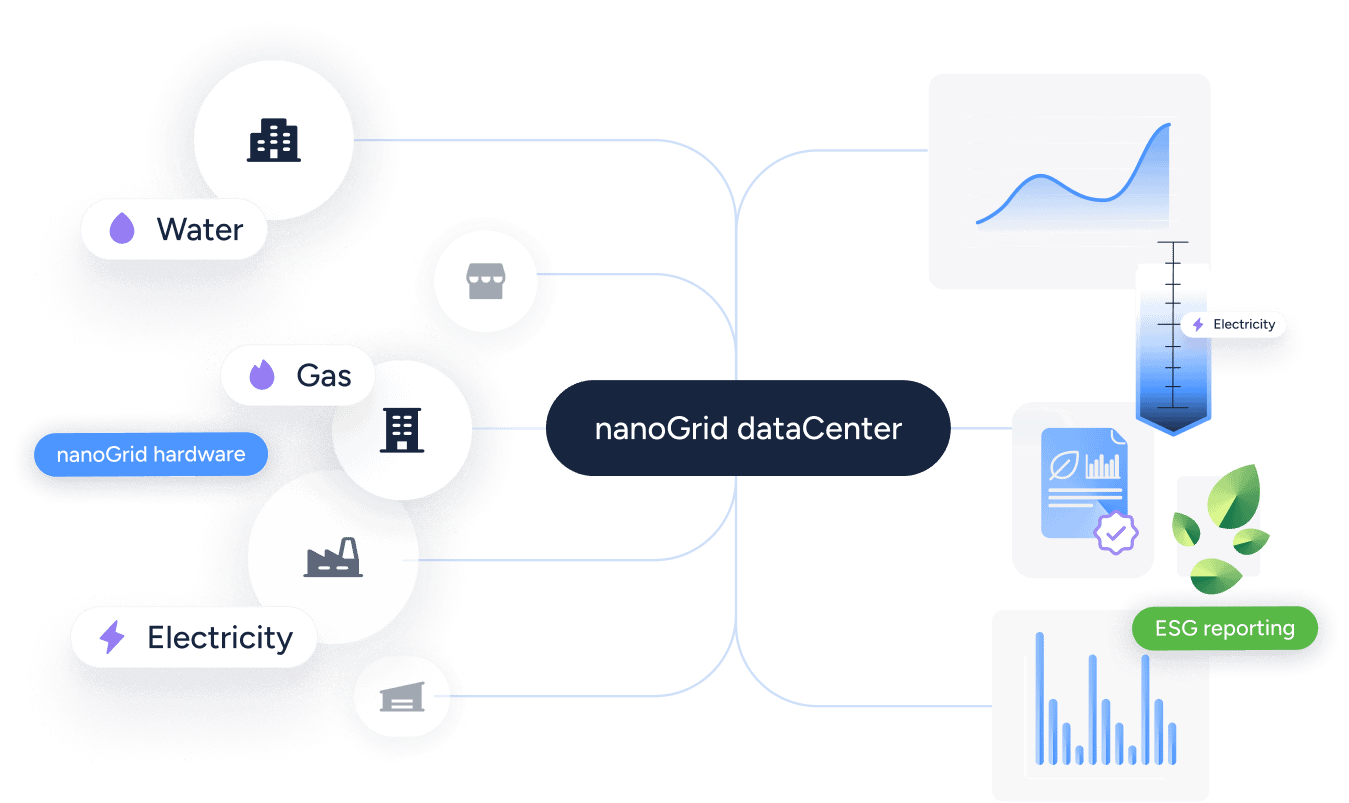
A utility data hub is a centralised system that collects, validates, structures, and distributes utility data across your entire portfolio. It sits between your meters and your analytics platforms, ensuring data remains accurate, complete, and traceable before it reaches any downstream system.
How does a data hub work? It connects to every meter regardless of type, age, or protocol. It validates every data point against quality criteria. It structures consumption data into hierarchical models matching your organisational needs. It distributes clean, verified data via API to every system that needs it. With nanoGrid, dedicated hardware sits inside each building, ensuring precise, real-time data capture straight from the meter.
Four core functions define its value: collect, validate, structure, distribute.
Crucially, a utility data hub doesn't replace your BMS or ESG tools. It's the layer that makes them work. Metering companies keep billing. BMS platforms keep controlling buildings. ESG tools keep generating reports. The hub ensures the data flowing between these systems is accurate, complete, and audit-ready.
The Comparison
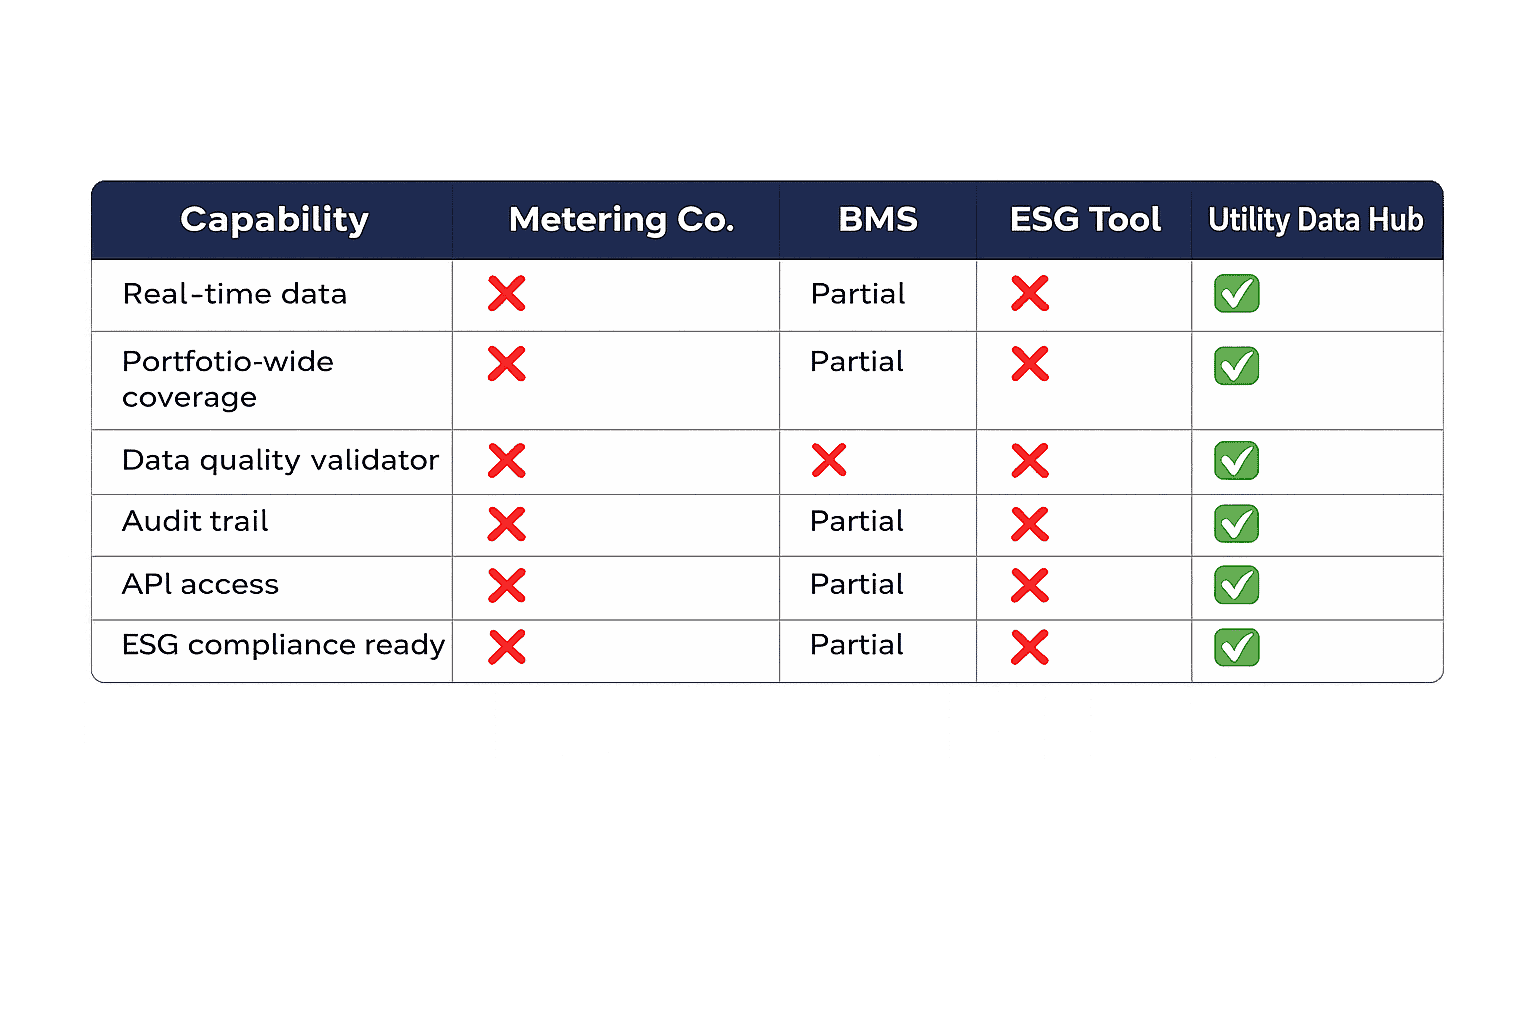
The pattern is clear. Every system has gaps. Only the utility data hub addresses all six criteria essential for reliable ESG data integration.
ESG Data Integration in Practice
Real ESG data integration looks like this: meters collect consumption data continuously. The hub validates every data point, flags gaps, scores quality, and structures everything into a complete dataset.
A secure energy data API then distributes verified consumption data directly to your ESG platform, ERP system, and business intelligence tools.
No manual uploads. No CSV chaos. No data gaps appearing three weeks before your CSRD submission deadline.
How nanoGrid functions as your utility data hub
Let’s take a closer look how we tackle it at nanoGrid. nanoGrid's API feeds validated electricity, gas, and water consumption data directly into platforms like Measurabl, Deepki, and Scaler (see all our integrations). Every data point quality-scored. Every gap documented. Every consumption record traceable back to source meters with timestamps.
The result: audit-ready ESG data flowing automatically to reporting platforms. Organizations gain actionable insights without manual reconciliation. Investors receive accurate sustainability data supporting informed risk management decisions. Auditors find complete, traceable datasets instead of PDF invoices and spreadsheet estimates.
This is what real estate data integration means in practice. Not connecting systems superficially, but ensuring data accuracy at every step between meter and report.
Why real estate portfolios need all four systems working together
Data integration in real estate: The "and" not "or" approach
Real estate data integration isn't about replacing existing systems. It's about connecting them intelligently.
Metering companies keep billing. BMS platforms keep controlling buildings. ESG tools keep reporting sustainability performance. Let's call it an utility data hub, ensures data remains accurate, complete, and traceable as it flows between all three.
Real estate professionals gain actionable insights from technology investments already in place. No ripping out functional systems. No starting from scratch. The hub adds the missing layer: data quality assurance, portfolio-wide aggregation, and API-driven distribution to every downstream platform.
Strategic decision making requires accurate, continuous utility data as its foundation. Without it, organisations manage portfolios based on estimates, assumptions, and incomplete datasets. With it, every operational and sustainability decision gets backed by verified consumption data.
The business case for getting ESG data integration right
The stakes of poor ESG data integration are significant.
Investors use ESG data for risk management and investment decisions, relying on frameworks such as GRESB and CRREM.
Financial institutions increasingly tie financing costs to verified sustainability performance. Poor data quality signals operational weakness and raises governance concerns. Accurate ESG data integration directly impacts your cost of capital.
Regulators require traceable, verified data for CSRD compliance. Organizsations submitting ESG disclosures built on estimated or unverified data face compliance failures and reputational damage. Greenwashing risk emerges not from intention but from poor data infrastructure.
Getting ESG data integration right delivers measurable competitive advantage. Lower financing costs. Stronger investor trust. Audit-ready compliance without last-minute data scrambles.
Conclusion: ESG data Integration starts With owning your data
BMS, metering companies, and ESG tools each serve crucial functions in your portfolio's technology stack. None of them, individually or collectively, ensures data accuracy, continuity, and structure across your full portfolio.
That responsibility belongs to the utility data hub: the ESG data integration layer connecting meters to analytics, billing to reporting, and operational data to strategic decision making.
Organizations that recognize this stop treating utility data as a billing byproduct and start treating it as strategic infrastructure. The result: complete, validated datasets enabling genuine sustainability performance rather than estimated reporting.
For a deeper understanding of how this foundation works, explore our guides on utility data management and time series data. Both explain why the data layer underneath your ESG stack determines whether everything built on top of it actually delivers value.
Leading real estate portfolios like WDP and Goodman chose nanoGrid because they needed more than reports, they needed data they could prove.
Book a demo to see how nanoGrid's approach to utilities data delivers audit-ready ESG data across your entire portfolio, without ripping out the systems you already have.
Frequently Asked Questions
What is ESG integration?
ESG integration is the process of connecting verified environmental, social, and governance data from source systems to reporting platforms. In real estate, this means linking utility meter data through a validation layer to ESG reporting tools, ensuring accuracy and traceability at every step.
What are the four ESG data types?
The four types are: (1) Reported data from published ESG disclosures; (2) Estimated data using industry proxies and averages; (3) Sampled data from periodic meter readings; (4) Continuous time-series data from automated collection. Only continuous, integrated data meets CSRD audit requirements.
What are the 5 P's of ESG?
The 5 P's are: Purpose (why ESG matters to the organization), People (who owns ESG performance), Process (how data is collected and validated), Performance (measurable ESG outcomes), and Proof (audit-ready documentation supporting ESG claims). Each requires accurate data integration to function effectively.
What is an ESG data example?
Validated electricity consumption of 47,500 kWh monthly, collected at 15-minute intervals from all building meters, quality-scored, and delivered via API to an ESG reporting platform for automatic Scope 2 emissions calculation. No manual uploads. Full audit trail.
What are the 4 P's of real estate?
The 4 P's are: Property, Price, Place, and Performance. ESG data integration now adds a fifth dimension: sustainability performance backed by verified utility data.
What is integration in real estate?
Integration in real estate connects different systems and data sources into unified operational capabilities. Data integration links metering systems, BMS platforms, and ESG tools through a central utility data hub ensuring consistent, accurate data flows.
How is data analytics used in real estate?
Data analytics enables benchmarking, forecasting, ESG reporting, and cost optimization. Effective analytics requires clean, integrated utility data feeding analytical platforms through validated, structured data pipelines delivering actionable insights.
How does a data hub work?
A data hub collects data from multiple sources, validates quality, structures it into standardized formats, and distributes it to downstream systems via API. For utility data, it connects meters to ESG platforms ensuring accurate, continuous data flow without manual intervention.
What are the benefits of a data hub?
Key benefits include centralized data management, improved data quality, automated ESG reporting, reduced manual effort, better strategic decision making, and audit-ready documentation. For real estate portfolios, a utility data hub eliminates fragmentation across metering companies, BMS platforms, and ESG tools.