Energy Management System ISO 50001: EnPIs & Baselines

Many organisations complete their gap analysis, build their energy policy, and define the scope of their energy management system (EnMS). Then they stall.
“The second most cited challenge in ISO 50001 projects is ‘difficulty to determine the energy baseline and energy performance indicators’ due to complex data measurement.” (Bohrium, 2025)
The point where ISO 50001 implementation most often stops is energy performance indicators (EnPIs) and energy baselines. Not because the concepts are complicated, but because this part requires real, granular, continuous energy data.
ISO 50001 is an international standard published by the International Organization for Standardization. Its purpose: help organisations continually improve energy management, reduce energy consumption, lower greenhouse gas emissions, and reduce reliance on fossil fuels as part of a broader response to climate change and rising greenhouse gas emissions globally. The benefits are substantial. Organisations that implement a well-run energy management system EnMS report lower energy costs, improved environmental performance, and the environmental credentials that investors and regulators now expect.
This guide covers exactly what Clauses 6.4 and 6.5 demand, how ISO 50006 provides the methodology to meet them, and what a defensible measurement and verification process looks like across a multi-site portfolio.
What the Energy Management System ISO 50001 Requires for Baselines and EnPIs
Two clauses define the measurement backbone of any 50001 energy management system and must be documented before a Stage 1 audit can proceed.
- Clause 6.5 requires organisations to establish an energy baseline using data from a defined reference period. The baseline is a fixed reference point representing normal energy performance before improvement actions begin. Every energy performance improvement claim is measured against it.
- Clause 6.4 requires energy performance indicators (EnPIs) to be selected, tracked, and maintained over time. Both must be documented, traceable, and directly linked to the significant energy uses identified in your energy review. Internal audits check these records at every surveillance visit, and a second internal audit during the three-year certification cycle is standard practice missing documentation is the fastest route to a non-conformity. For a full breakdown of what auditors check at each stage, see our guide to the iso 50001 audit process and evidence pack requirements.
Where ISO 50006 Comes In
ISO 50006 is the companion ISO standard providing the practical methodology for meeting these requirements. ISO 50001 was designed to align with management system standards including ISO 9001 (quality management systems) and ISO 14001 (environmental management systems) through a shared High Level Structure. ISO 50006 covers how to define EnPI boundaries, how to normalise baselines when relevant variables significantly affect energy consumption, and how to set adjustment triggers that keep baselines valid across your existing management systems.
Identifying Significant Energy Uses: The Foundation Everything Else Builds On
Before you can set a baseline or define an EnPI. ISO 50001 Clause 6.3 requires you to complete an energy review and identify your significant energy uses. SEUs, or significant energy usage, are the systems, processes, or areas with the largest share of energy use or the greatest potential for improving energy efficiency. They are where your ISO 50001 energy management must actually focus.
Why Invoice Data Cannot Identify Your SEUs
Invoice data shows total energy consumption per site per billing cycle. It tells you nothing about which system is driving that energy use. Whether HVAC, lighting, production equipment, or server infrastructure is responsible for energy consumption across your estate is invisible in a monthly bill.
Identifying SEUs requires time-series data at system level. This means submetering: permanent sub-meters on key circuits or a monitoring platform capturing data at sub-daily resolution. Without it, you cannot identify where energy waste occurs, which processes are undermining efficiency, or where reducing energy consumption would deliver the most gains. The benefits of correct SEU identification are direct: you can prioritise energy saving initiatives, demonstrate improved energy performance, and build a credible pathway to reducing environmental impact.
How to Build a Defensible Energy Baseline Across Multiple Sites
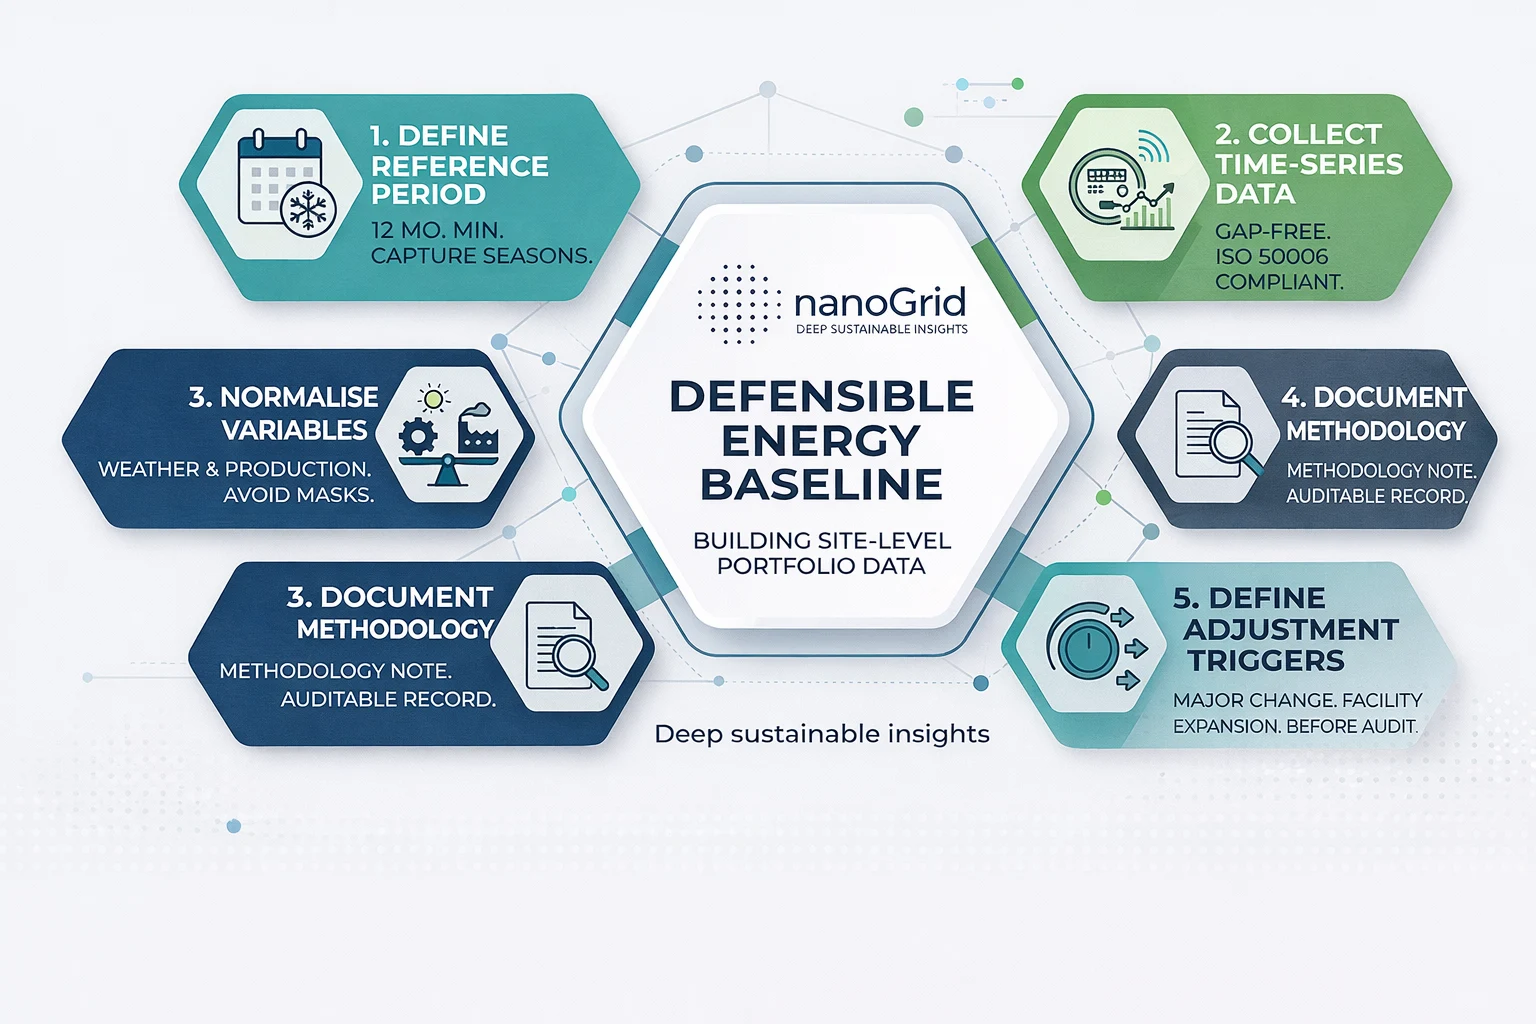
The critical rule for multi-site portfolios:baselines must be set at site level, not portfolio level. Aggregationhides site-specific consumption patterns, masks energy waste, and will notsurvive a Stage 2 audit.
1. Define the reference period
Minimum 12 months, to capture full seasonalvariation. Logistics hubs with high winter heating demand or retail sites withheavy summer cooling loads benefit from a longer reference period to reducenormalisation error.
2. Collect complete time-series data
The data must be continuous and gap-free. ISO50006 is explicit: data gaps weaken the baseline. Anyestimated fill must be documented and auditable. Continuous monitoring fromconnected meters is the only reliable way to guarantee a complete referencedataset across a large portfolio.
3. Normalise for relevant variables
If energy consumption is materially influenced byproduction volume, outdoor temperature, operating hours, or occupancy, thebaseline must be normalised. A cold winter increases energy use in ways thatlook identical to genuine energy efficiency improvements unless the baseline isadjusted for weather. Poor normalisation also masks real opportunities:reducing energy consumption through better HVAC scheduling looks the same as aweather effect if your baseline is not weather-corrected.
4. Document the baseline methodology
The methodology note is a mandatory deliverable. Itmust describe what data was used, what reference period was applied, whatnormalisation was followed, and what will trigger recalculation. Internalaudits of the 50001 energy management system will check this record at everysurveillance cycle.
5. Define adjustment triggers in advance
ISO 50001 requires baselines to be reset whensignificant changes occur: major equipment replacement, facility expansion,changes in production processes, or a significant tenant move. Define thesetriggers before the audit cycle begins.
Struggling to set consistent energy baselinesacross your portfolio? nanoGrid gives you the site-level time-series data youneed, from day one.
Setting EnPIs That Reflect Real Energy Performance
Energy performance indicators (EnPIs) sit at thecore of ISO 50001's continual improvement cycle. They are how you fix targets,track energy performance over time, and demonstrate that your energy managementsystem is working. The direct benefits: you reduce costs, surface inefficiencyearlier, and build an auditable improvement record. ISO 50001 energy managementwithout functional EnPIs is a policy document, not a system.
Common EnPI Forms
Absolute consumption (kWh, m³,GJ): works where energy usage is not driven by variable external factors.
Energy intensity ratio (kWh/m²,kWh/unit output, kWh/FTE): the most common form for multi-site energyefficiency benchmarking. Energy efficient technologies that reduce kWh/unitoutput are measured directly against this EnPI type. It is also the preferredform for demonstrating continual improvement and reducing energy against aregulatory requirements framework.
Carbon intensity per unit of output: trackscarbon emissions in relation to production, aligning energy objectives withbroader climate change targets and helping reduce carbon footprint.
Percentage improvement against baseline: the formmost directly tied to ISO 50001's continual improvement requirement. This isthe EnPI form auditors most expect to see linked to each significant energyuse.
What Makes an EnPI Worth Setting
ISO 50006:2023 is clear:the EnPI boundary should align with the functional role of the personresponsible for managing that area. Top management must ensure chosen EnPIs areappropriate and that the energy team has resources to track them continuously.
Well-designed performance indicators (EnPIs) reduceenergy costs, deliver cost savings, support sustainability reporting, and drivecontinual improvement across the energy management system. They also providethe efficiency data needed for performance evaluation, management reviews, andinternal audits, and build the environmental management credentials investorsincreasingly expect.
Common EnPI Mistakes
EnPIs driven by external variables with nonormalisation. Too many performance indicators (EnPIs) diluting focus. And themost common mistake in multi-site rollouts: EnPIs defined before the datainfrastructure to track them exists. When an EnPI value cannot be produced ondemand, it measures nothing. A problem that compounds at every managementreview and undermines the efficiency of the whole system.
Tracking utility time-series datacontinuously (like we do at nanoGrid) is the prerequisite for EnPIs that work.
Measurement and Verification: ISO 50015 in Practice
ISO 50015 answersthe question: did the intervention actually work? Where ISO 50006 coverssetting baselines and performance indicators EnPIs, ISO 50015 covers verifyingthat specific energy saving initiatives delivered the results claimed — andthat any energy efficiency improvement is real, not a product of seasonalvariation. It is used alongside IPMVP, which defines four M&V options.
Option A (retrofit isolation, keyparameter measurement): capacity measured, hours estimated. Appropriate forsimple interventions like a lighting retrofit.
Option B (retrofit isolation, fullymeasured): all parameters measured via sub-metering. The most defensibleapproach for portfolio applications. Every variable within the measurementboundary is tracked continuously, making it easy to verify savings, improve efficiency,and demonstrate reduced energy use to auditors.
Option C (whole-facility comparison):total site consumption compared before and after. Requires weathernormalisation.
Option D (calibrated simulation): fornew construction or deep retrofits where direct measurement is impractical.
Without pre- and post-intervention sub-meter data,savings cannot be verified under Option B. Corrective actions cannot beformally closed. This is the direct operational link between ISO 50015, yoursub-metering infrastructure, and iso 50001 continuous improvement [linkactive once published].
How nanoGrid Makes EnPIs and Baselines Scalable
On baselines: nanoGrid capturesutility data at meter and sub-meter level across all sites,regardless of meter age, protocol, or connectivity. M-Bus, Modbus, LoRaWAN,pulse output: all flows into a single time-series database. The referenceperiod data is complete by default. No gaps, no energy waste from undetectedanomalies, no estimation fills that weaken your Clause 6 documentation.
On EnPIs: thetechnology supports per-EnPI dashboard configuration withalert thresholds. When an EnPI drifts beyond a threshold, the energy team isnotified in real time. The result: faster detection of inefficiency, lowerenergy costs, measurable cost savings, and energy management improvements thathelp organisations reduce costs and reduce environmental impact across theportfolio.
On Measurement & Verification (M&V):submetering at system level creates the ISO 50015 Option B measurement boundaryautomatically. The full data lineage from meter to EnPI is traceable andexportable. That means compliance and sustainabilityreporting becomes a data export, not a manual process,supporting a sustainable future and demonstrating increasing profitabilitythrough efficient energy management.
Get the data layer right and the iso50001 processes follow.
Interested in how nanoGrid's portfolio data layersupports ISO 50001 EnPIs, baselines, and M&V, without the manual overhead? Booka call with the nanoGrid team