
How WDP gained real-time energy insights across 300+ buildings
Background: A growing need for data clarity
When you manage over 300 logistics buildings across six countries, data accuracy and clarity becomes currency.
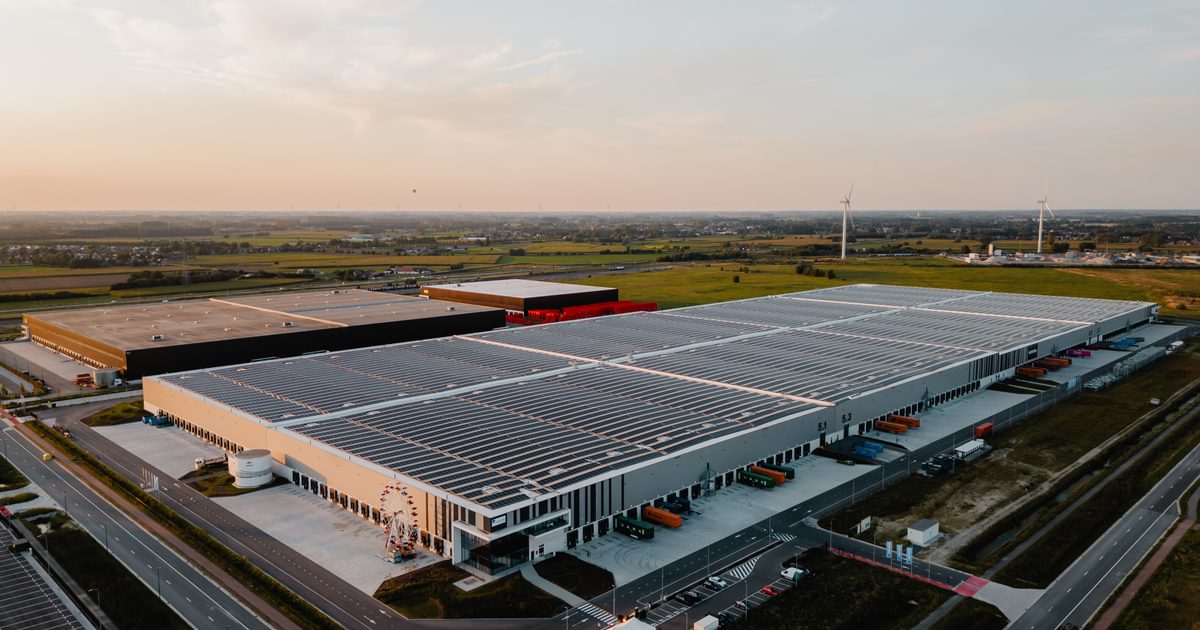
Warehouse De Pauw (WDP) is one of Europe’s leading real estate players in the logistics and warehouse sector. Their portfolio spans millions of square meters, serving some of the most demanding supply chains in the world.
For them, it’s not optional. Sustainability comes first. They’ve committed over €150 million to green mobility and renewable energy investments.
But managing that ambition at scale? That’s where things get tricky. It’s not that WDP lacked data. Quite the opposite. They were flooded with it, from facility managers, from building systems, from tenants.
The real challenge was making that data reliable, accurate, consistent, and useful across borders. Energy reports trickled in from six countries in different formats, languages, and with varying levels of completeness. Internal teams were spending more time deciphering spreadsheets than driving decisions.
And every ESG submission deadline? It felt like playing catch-up in a race that never slowed down.
Something had to change.
Challenge: When data isn’t the problem, but the flow Is
Their teams were experienced, motivated, and well-organized. But even a high-performing team hits friction when each site reports energy consumption its own way.
Multiply that across 300+ buildings, and you get a pile of different efforts without a unified result.
The result?
- Duplicate work for the sustainability team.
- Delayed insights for facility managers.
- And ESG reports that took far more effort than necessary.
WDP didn’t just want to report energy performance, they wanted to understand it. Live. Across the board. Without waiting for someone to email a file.
They needed a system that didn’t just gather data. It made it usable, instantly and reliably.
{{numbers}}
Solution: one platform, hundreds of sites
That’s why they came to nanoGrid.
From day one, the approach was simple: create a unified, real-time view of utility data across all WDP assets, regardless of location, language, or legacy systems. And do it without putting pressure on local teams.
Here’s what changed:
- Real-time utility tracking: electricity, water, gas, air quality, across all sites.
- Centralised dashboards tailored to both high-level ESG tracking and granular on-site performance.
- Certified, on-site installations by nanoGrid-approved technicians, all documented through detailed Post Intervention Files, vital for scoring platforms like BREEAM, GRESB or CRREM.
- Automated alerts for anomalies, leaks, or off-hours overuse, no more silent inefficiencies.
- Standardized data flows, ready for automated ESG submissions.
No more inconsistencies. No more last-minute file exports. The rollout wasn’t just smooth, it was made to stay smooth. Long-term maintenance of all data-loggers and meters ensured data didn’t degrade over time. And customized API connections meant WDP’s internal systems received updates in real-time, no manual handoffs needed.
Elke Van Den Broucke, WDP’s Head of Energy & Sustainability, described it best:
“nanoGrid’s platform has become an essential part of our daily operations. It allows us to monitor and control the energy consumption of our sites in real-time.”
Looking Ahead
WDP’s collaboration with nanoGrid isn’t just about ticking compliance boxes. It’s about raising the bar.
For the industry, for their tenants, and for what’s possible when technology and strategy align. Their story proves something simple yet powerful:
When the data flows, progress follows.
Our impact with WDP
+300
Measure points
+10%
Energy efficiency
+2100
Assets monitored