How Belfius bank cut gas consumption 28% across its offices

How offices of a nationwide branch network turned real-time HVAC control into measurable cost efficiency.
The challenge: balancing trust, comfort, and cost
Most financial institutions still manage energy costs reactive, watching monthly utility bills climb while boilers run on decades-old timer schedules.
Belfius faced this exact challenge across its 700+ Belgian offices in late 2017. Facility managers could only see consumption patterns weeks after the energy was consumed, leaving no window to correct waste before it hit quarterly budgets.
With gas costs rising and ESG reporting requirements tightening, the bank needed a shift from reactive billing analysis to proactive energy management. Facility managers could see the costs only when monthly invoices arrived, leaving no window to correct waste before it hit the bottom line.
The question wasn't whether to invest in energy management technology. It was how to find a platform and technology that could deliver guaranteed accuracy across an entire multi-site portfolio while integrating seamlessly with existing operational workflows.
Why Belfius went for nanoGrid
Many energy management platforms promise savings through device-level automation. Belfius took a different approach, recognizing that cost reduction starts with understanding exactly how energy flows through each building.
That’s where nanoGrid came into the picture:
The head office teams needed a single platform that could both reveal inefficiencies and act on it. At nanoGrid we combined:
· Sub-meter-level visibility for electricity, gas, and water, plus parameters such as voltage, power factor, temperatures, and even precipitation intensity.
· Remote control of boilers, ventilation units, and split-system air-conditioning, allowing schedules to follow opening hours and outdoor weather instead of guesswork.
· Dashboards readable by every internal stakeholder, eliminating time-consuming spreadsheet exchanges
The Boom (Antwerp) pilot: Data first, control next
Typically we did a first pilot. This one went live inBoom (Antwerp), a typical mid-sized office.
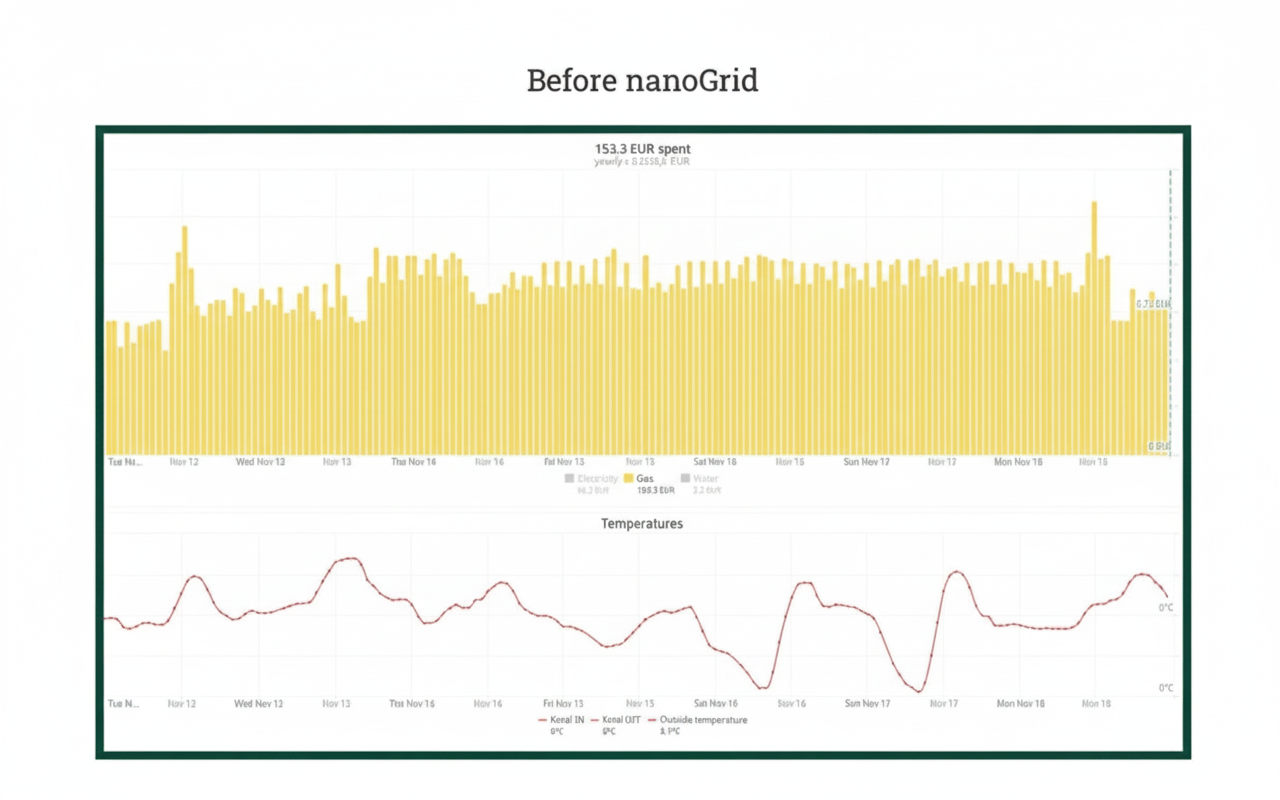
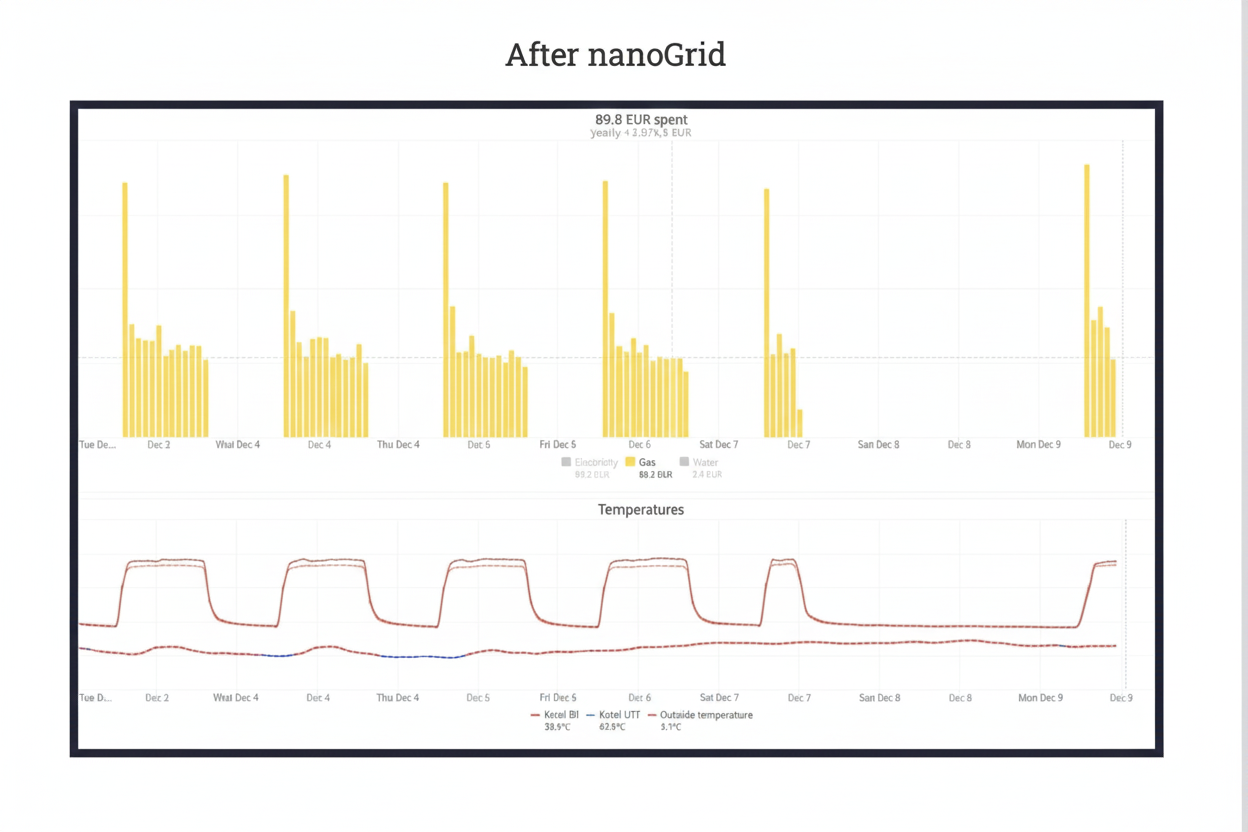
nanoGrid tied local weather forecasts to boiler set-points, tracked supply- and return-water temperatures, and learned the building’s warm-up profile. During closing hours the system throttled back automatically, yet every morning the lobby still reached the target temperature before the doors opened.
{{numbers}}
Measurable results: 28% gas reduction without comfort compromise
In a single heating season the Boom branch cut its gas use by 28 procent, halved after-hours “silent” demand, and saw zero comfort complaints.
The nanoGrid dashboard showed the consumption-curve flattening day by day. And the next quarterly utility bill confirmed the savings. This is proof that data-driven control can pay for itself quickly.
Portfolio wide impact
The Boom-pilot project repaid its hardware and installation costs inside a year. Afterwards the amount of offices using nanoGrid grew exponentially up until around 100+ offices up to this day. Live performance data now feeds straight into corporate ESG reporting, removing manual consolidation.
Curious what nanoGrid could do for your assets?
Ready to explore how energy data intelligence could transform your multi-site operations? Consider starting with a representative pilot location to validate the approach before portfolio-wide deployment.
Our impact with Belfius
28%
Gas reduction
≈50%
Lower after-hours “silent” demand
300+
Offices using nanoGrid today