In 2025, ESG expectations in real estate are crystal clear. They’re now measured, enforced, and shaped by the market.
From investors and regulators to tenants and fund managers, everyone is analysing how real estate portfolios adapt to sustainability challenges.
At the core of this evolution there are two main frameworks: GRESB and CRREM.
GRESB measures how well you’re managing ESG at a portfolio level.
CRREM tells you if your buildings are on track or at risk, on a carbon pathway level.
This article isn’t an overview of definitions.
Instead, we’ll explain how these two frameworks complement each other, and how their integration helps portfolio managers meet ESG goals with clarity.
If you’re looking for the full breakdown, get a deeper insight in our other articles on our blog:
- What is GRESB? A Clear Guide to GRESB Reporting in Real Estate
- Understanding CRREM: Future-Proof Real Estate Industry from Carbon Risk
What is GRESB? vs. What is CRREM? (in one minute)
See it this way: think of GRESB and CRREM as two essential tools in your ESG toolkit. Each one serving a more or less different purpose, but both still critical for long-term value and compliance.
GRESB 101: What is it?
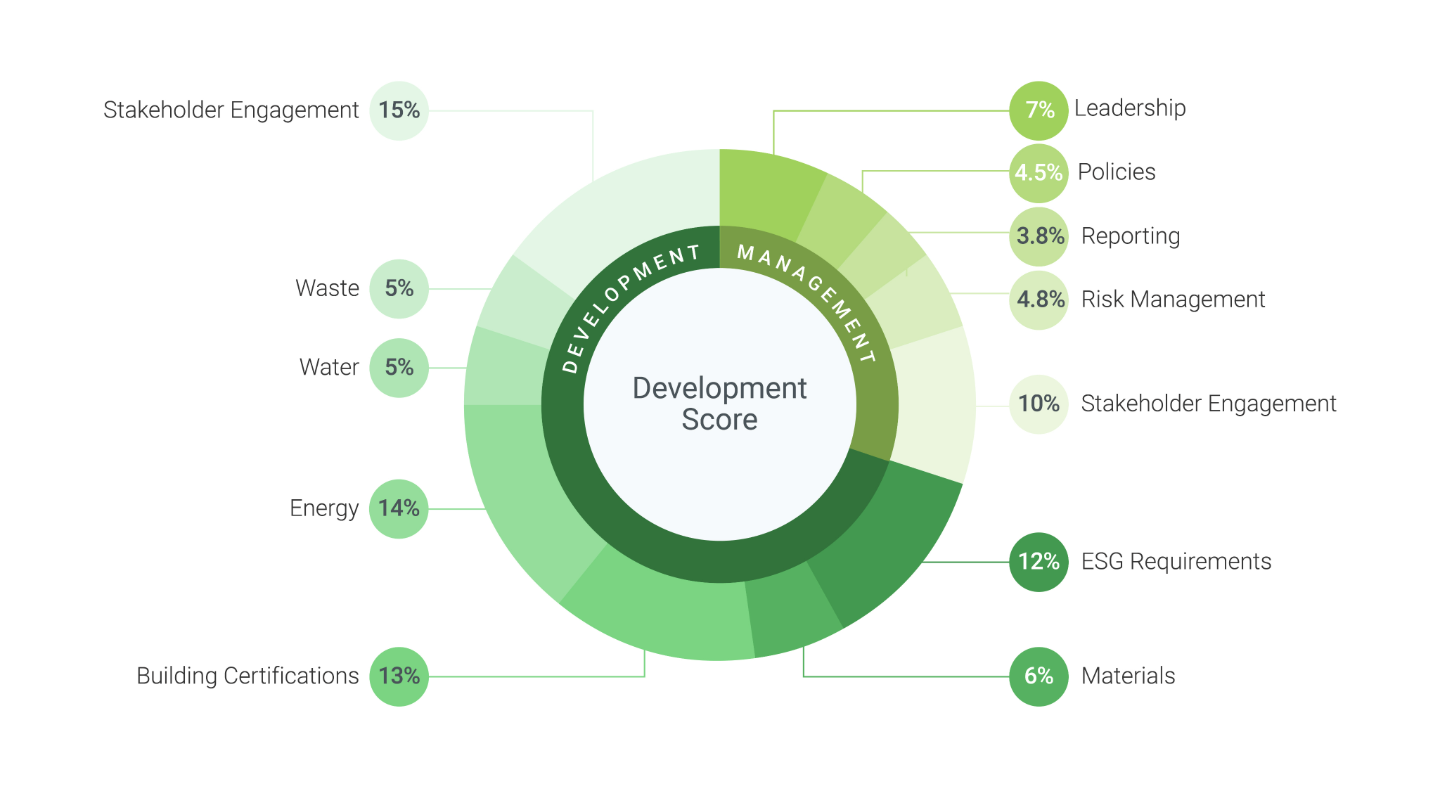
GRESB is an ESG benchmarking framework introduced for the financial markets. Overall, it evaluates the sustainability performance of real estate portfolios, from policies and reporting practices to actual energy use and stakeholder engagement. It’s a benchmark. In other words, GRESB tells you how your performance and strategy stack up in the market or peers.
Want the full breakdown?
- Read of GRESB guide
- Or read our in-depth article with 8 actionable tips to improve your gresb score

CRREM 101: What does it entail?
CRREM is different from GRESB. It’s a science-based decarbonization model. Rather than scoring your entity on a scale or against benchmarks, CRREM shows whether your buildings align with international climate goals, in particular the Paris Agreement. It maps carbon intensity per m2 against time-bound emissions thresholds to help you avoid misalignment risk.
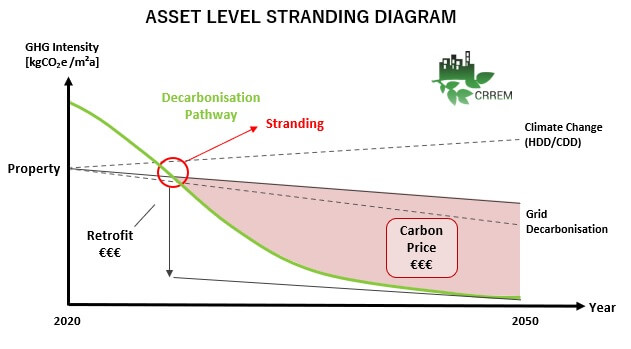
CRREM asset level stranding diagram (source: CRREM)
Yes, we know, it might all sound a bit unclear and blurred, that’s why we have created a full CRREM guide. Read further on our in-depth CRREM guide.
GRESB vs. CRREM?
Let’s be clear:
- GRESB ≠ carbon compliance. You can score high without knowing if your assets align with 1.5°C pathways.
- CRREM ≠ ESG ratings. You can follow CRREM and still miss GRESB points for management or engagement.
That’s why, in our opinion, in real estate today, you need both:
- GRESB shows how you perform in capital markets.
- CRREM shows if you’re ready for a low-carbon future. Helps you prove you’re on the right path.
Together, they build a credible, data-backed sustainability story. One that balances investor trust with real climate alignment.
Why the real estate industry needs both a score and a pathway?
In 2025, having a good GRESB score or high GRESB rating is no longer enough. Neither is aligning your building to a CRREM pathway.
GRESB acts as your performance signal to the market. Showing investors how your fund or portfolio is tracking ESG metrics. Like energy use, stakeholder engagement, and resilience planning. It’s the benchmark where capital markets look at when deciding who’s leading and who’s lagging.
On the other hand, CRREM serves as your carbon roadmap. It tells you, asset by asset, whether your real estate is on track with the decarbonisation goals, or heading toward stranding risk.
It helps you understand how much to reduce, by when, and how that aligns with global pathways.
Simply put, the market now demands both proof of performance and a path to decarbonisation.
Frameworks like SFDR, CSRD, and national taxonomies increasingly ask you to:
- Disclose ESG performance with validated, comparable data (GRESB).
- Show how you align with science-based decarbonisation targets (CRREM).
They push in the same direction, toward more sustainable, cleaner real estate.
GRESB is your external scorecard, CRREM is your internal strategy.
Together, they help demonstrate:
- Climate risk awareness
- Real alignment with the Paris Agreement
- Ability to manage transition risk
- A credible sustainability trajectory investors can trust
How CRREM supports GRESB performance
Here’s where things get interesting.
CRREM isn’t just a carbon tool, it can boost your GRESB score as well.
If your real estate buildings are aligned with with CRREM’s decarbonisation pathways, you’re not just managing carbon risk. You’re improving performance in several parts of your GRESB Real Estate Assessment.
Let’s break it down.
1. Carbon performance = GRESB points
CRREM helps you track and forecast greenhouse gas emissions at the asset level.
That aligns with the Performance Component of your GRESB score, especially under:
- Energy use intensity
- GHG emissions
- Carbon performance indicators
- Like-for-Like (LfL) improvement metrics
When your assets stay under CRREM thresholds or show year-over-year improvement, this high-quality, verified data supports your GRESB Performance score, as GRESB recognizes the value of robust carbon and energy data aligned with CRREM pathways.
2. Climate risk management = strategy points
GRESB assesses not only your carbon footprint but also how you manage climate risk. CRREM provides a science-based method to:
- Identify stranding risk by asset
- Plan capital expenditure (CAPEX) around transition risk
- Create credible decarbonization roadmaps
This aspect of CRREM supports your GRESB Management Component, especially in areas such as climate strategy, scenario planning, and risk disclosures, as GRESB encourages the use of recognized methodologies like CRREM for transition risk management.
3. CRREM is “part of” the GRESB ecosystem
Here’s something most overlook:
GRESB recognizes and integrates CRREM within its ecosystem. In recent years, GRESB has formally cited the CRREM methodology in its guidance for climate targets and transition risk strategies.
GRESB has also automated the process of filling in the CRREM Tool with asset-level data from the GRESB Asset Portal, and its Transition Risk Report benchmarks assets against CRREM’s decarbonization pathways. Aligning with CRREM is therefore directly relevant to your GRESB score and transition risk reporting.
Want to know more about improving your GRESB score?
Read our article on How to Improve Your GRESB Score: 8 Tips for CRE Portfolio Managers. You’ll see how utility data + CRREM pathways equals performance points.
The path to low-carbon real estate starts with asset-level data
If there’s one thing both CRREM and GRESB agree on. It’s this decarbonisation can’t be done without proper data. Not just any data, but asset-specific, traceable data.
That’s because climate performance is no longer measured in averages. It’s measured per building, per meter, and even per hour.
Let’ s showcase this with a real-life example: a warehouse in Spain with outdated HVAC system and high cooling demand has a whole different carbon risk profile than a fully electric office in Berlin. This is because both CRREM and GRESB assessments are sensitive to asset-level differences such as location, system efficiency, and energy source.
And regulators, investors, and ESG platforms now expect companies to know and prove that. In fact, both GRESB and CRREM explicitly call for asset-level data coverage as a condition for accurate reporting and valid benchmarking.
CRREM works one building at a time
CRREM’s model is purely built around building-specific carbon intensity. Every asset gets its own custom pathway. Based on factor like size, location, property type, national grid, … This means you need granular, verified data per asset. Not just rough portfolio averages.
Each building’s alignment with the Paris Agreement (1.5°C or 2°C) is calculated independently. That requires clear visibility on:
- Operational energy consumption
- Scope 1 and 2 greenhouse gas emissions
- Floor area and asset use
- Local electricity emission factors
- Retrofit actions or energy upgrades
GRESB is evolving: Asset-level performance required
GRESB’s recent updates (April 2025) now also place strong focus on per-asset scoring.
Their new Score Contribution Dashboard shows which buildings pull your GRESB score up, and which ones drag it down. This isn’t just about appearances, performance indicators like energy use, GHG emissions, and data coverage are scored separately. So you know how to improve better.
Which means poor visibility or data coverage on one building, can lower your overall GRESB score, even if the rest of your portfolio performs well.
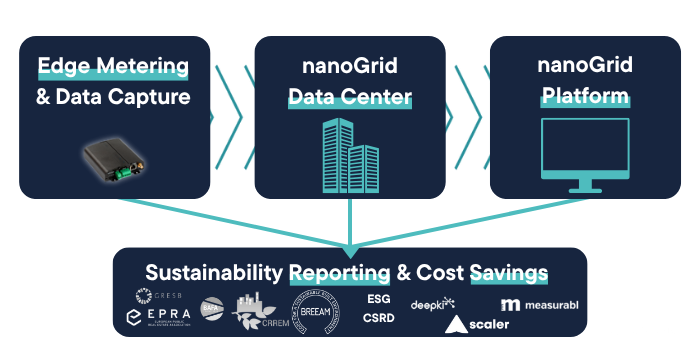
Where nanoGrid’s utility monitoring technology comes in
That’s just where nanoGrid adds tangible value.
We specialize in delivering real-time, traceable, granular utility data for every utility and every building. Through our own on-site hardware, we:
- Collect the most accurate energy data directly from electricity, gas, water, and heating meters, including legacy or sealed meters. With in-house developed hardware and software.
- Ensure coverage even when tenants or utility providers aren’t cooperating
- Provide automated CRREM + GRESB-ready exports, asset by asset
- Enable benchmarking and portfolio-wide analysis between all of your sites and locations.
So whether you’re calculating carbon risk under CRREM or proving year-on-year improvement in GRESB, the data you need will be available.
- Want the bigger picture on why utility data matters? Read our full article about utility data management and how it support ESG efficiency and reporting.
- Need help unlocking real-time submetering? Start here with our overall guide to submetering.

The Risk of going “GRESB-only”
As we know by now, GRESB is a powerful ESG benchmark but relying on it alone can leave real estate portfolios exposed to risk.
It’s possible to score well in GRESB’s Management Component, by having solid ESG policies, leadership structures, and reporting systems. While your actual assets are still poorly aligned with climate targets.
Let’s say a logistics real estate portfolio has a well-documented sustainability governance, engagement programs and some energy-saving upgrades. On paper, they may look good enough to earn a 4-star GRESB rating.
But if the underlying energy consumption remains high, or GHG emissions exceed, the asset still faces stranded asset risk under CRREM pathways.
Good reporting ≠ good carbon performance.
How to Align GRESB Reporting with CRREM Pathways
Let’s say GRESB is your overall ESG scoreboard and CRREM your carbon guide, the value lies in connecting the two. Done right, it’s a roadmap to portect long-term value, reduce risk and improve sustainability performance year over year.
But how exactly can sustainability managers connect these dots?
Here are four practical tips to align GRESB reporting with CRREM pathways, and ensure your assets stay on track:
1. Your Climate Strategy in CRREM Benchmarks
Start by reviewing your climate strategy. Is it just a vague promise, or does it link to clear decarbonization targets?
CRREM gives you science-based pathways tailored to your property type, location, and energy use. These show how fast and how far emissions must drop to meet 1.5°C or 2°C Paris Agreement goals.
By aligning your goals with CRREM, you also boost your GRESB Management score by showing:
- Credible carbon targets
- Measurable milestones
- A link to recognized frameworks like SFDR, CSRD, and TCFD
2. Use the CRREM Misalignment Year to Time Capital Projects
The CRREM tool calculates a “stranding year”. Which is the point when a building’s emissions cross the pathway.
This insight is gold for CapEx planning. But don’t just retrofit blindly. Use misalignment analysis to:
- Prioritize upgrades based on urgency and risk exposure
- Time interventions before carbon performance falls off a cliff
- Optimize investment ROI based on climate and market alignment
GRESB doesn’t ask for your misalignment year. But investors increasingly expect to see the logic behind your energy upgrade timelines , and CRREM proves it.
3. Map GRESB Actions to CRREM Outcomes
Most portfolios have robust GRESB management component initiatives: green policies, climate committees, stakeholder engagement, and disclosure protocols.
The next step? Show how those efforts directly support CRREM-aligned performance.
For example:
- Use your stakeholder engagement strategy to secure tenant cooperation for submetering and energy disclosure
- Link your risk management process to physical and transition risks identified via CRREM
- Align (ESG) reporting tools (e.g. Measurabl, Deepki, Scaler) to track year-over-year performance relative to both GRESB scores and CRREM carbon thresholds
This mapping adds strategic depth to your GRESB reporting, transforming ESG paperwork into a forward-looking performance framework.
4. Power it with accurate, real-time utility data
At nanoGrid, we make it simple to align GRESB and CRREM, because both frameworks demand traceable asset-level data.
Whether you’re submitting GRESB assessments, running CRREM analysis, or preparing ESG/CSRD reports, the foundational data is the same:
- Real-time, accurate energy consumption data
- Accurate Scope 1 & 2 GHG emissions
- Traceable data streams down to individual meters, tenants, or systems
We install and maintain on-site hardware to ensure total data coverage, even for old or sealed utility meters. Our SaaS platform provides:
- CRREM- and GRESB-ready reporting templates
- Direct API-integration with ESG reporting tools like Deepki and Measurabl
- Instant visibility into underperforming assets
The result? No more data gaps. No more estimate-based risk. Just aligned, auditable utility data across both CRREM and GRESB.
Conclusion: One Score, One Pathway Real Progress Needs Both
To summarize it:
GRESB shows the world how you’re performing on a sustainability dimension. CRREM shows if you buidlings are truly on track for the decarbonization goals. Used together, they don’t just tick the ESG boxes. They protect value, reduce transition risk, and future-proof your real estate portfolio.
The real estate market no longer accepts ambition without real proof:
- GRESB scores and rating signal progress.
- CRREM pathways prove alignment.
That’s why you need both.
The nanoGrid Advantage: traceable utility data
At nanoGrid, we deliver traceable, granular utility data that helps you improve data coverage for both GRESB and CRREM.
Our platform is built to support both GRESB assessments and CRREM carbon performance modeling, using the same stream of verified, real-time utility data.
Here’s what we deliver:
- Near-100% utility data coverage, regardless of meter type, utility provider, or asset location
- Real-time energy consumption tracking, including electricity, gas, water, and district heating
- Audit-ready reporting formats compatible with tools like Deepki, Measurabl, and the CRREM Excel tool
- Scope 1, 2, and even Scope 3 emissions tracking, with clear links between building systems, consumption, and tenants
- Submetering and tenant-level breakdowns, allowing you to report actual occupant usage without estimation
Interested how we cover almost 100% of your utility data? Contact us and we’ll be in touch right away.